
Extended Data Fig. 2. p21 expression in tdTomato+ and tdTomato− cells in old mice.
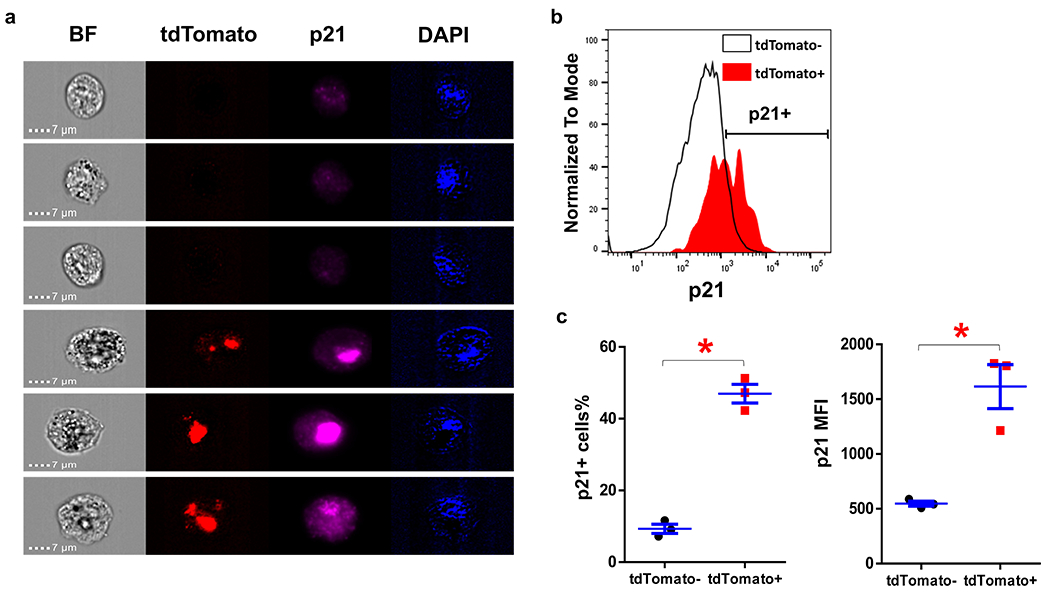
(a) Representative images of tdTomato+ and tdTomato− SVF cells in old PT mice. (b) p21 staining intensity of tdTomato+ and tdTomato− SVF cells detected by flow cytometry. (c) p21+ cells percentage and p21 mean fluorescence intensity (MFI) of tdTomato+ and tdTomato− SVF cells. For c, n=3 for both groups. Results were shown as mean ± s.e.m. * p< 0.05; two-tailed, paired Student’s t-test. p=0.009 for p21+ cells%; p=0.028 for p21 MFI.