
Figure 5. p21high cells exhibit features of cellular senescence.
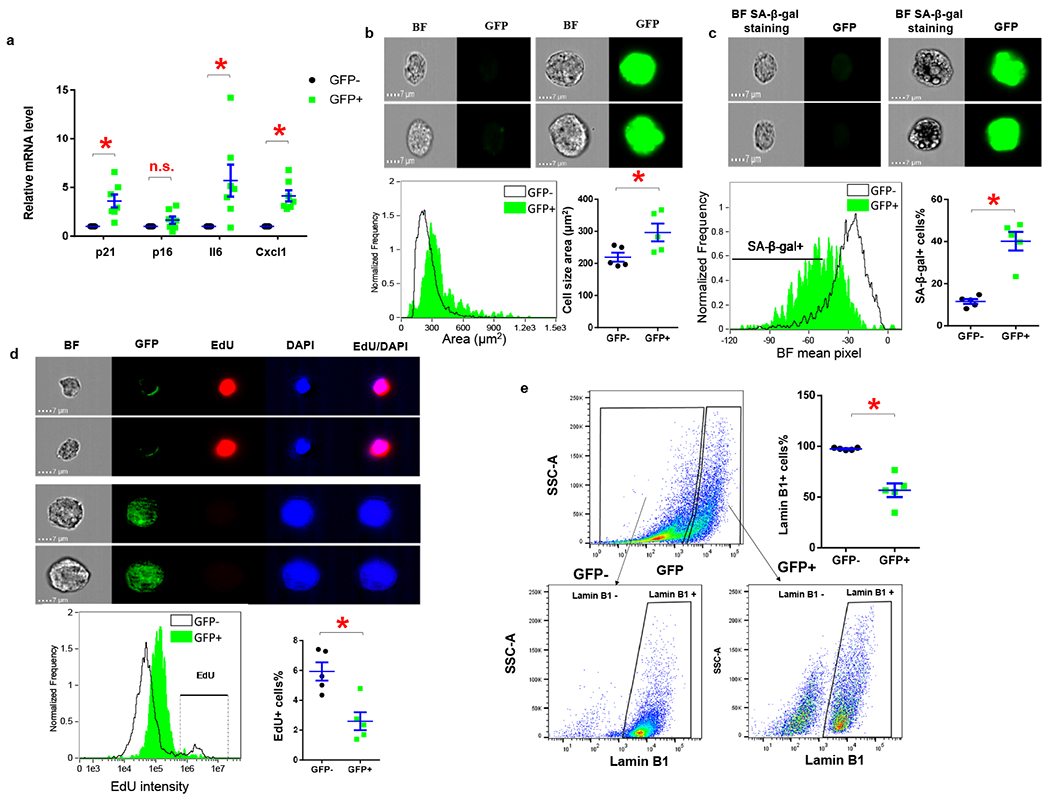
(a) Relative mRNA expression in GFP+ p21high cells and GFP- cells sorted from SVF from obese PL mice. * p< 0.05; two-tailed, paired Student’s t-test. p=0.008 for p21; p=0.1365 for p16; p=0.029 for Il6; p=0.002 for Cxcl1. (b) Representative images, cell size distribution and average cell size of GFP+ and GFP- cells. * p=0.006; two-tailed, paired Student’s t-test. (c) Representative images, mean SA-β-gal staining pixel distribution, and SA-β-gal+ cells as a percentage of GFP+ and GFP- cells. * p=0.003; two-tailed, paired Student’s t-test. (d) Representative images, mean EdU staining intensity distribution, and EdU+ cells percentage of GFP+ and GFP- cells. * p=0.019; two-tailed, paired Student’s t-test. (e) Flow cytometry analysis of Lamin B1 in GFP+ and GFP- cells. For A, n=7 for both groups. For b-e, n=5 for both groups. Results are shown as means ± s.e.m. * p=0.004; two-tailed, paired Student’s t-test.