
Extended Data Fig. 1. p16high and p21high cells are two distinct cell populations in aged tissues.
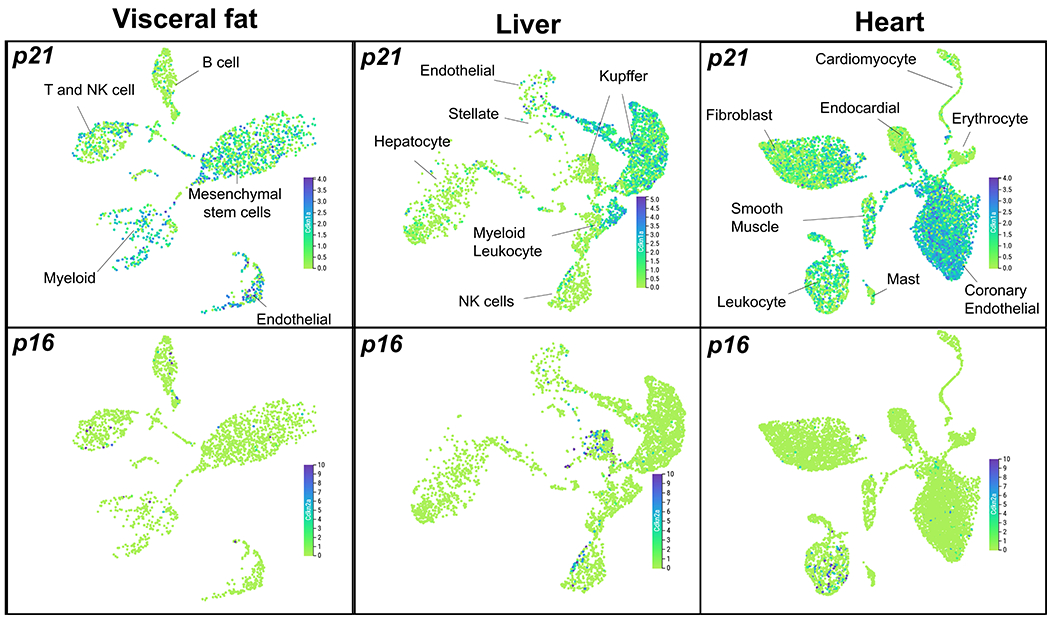
Uniform manifold approximation and projection (UMAP) plots showing expression levels of p21 (cdkn1a) and p16 (cdkn2a) in visceral fat, liver and heart in 18-30 months old mice. The figures were generated using the Tabula Muris Senis interactive platform (https://tabula-muris-senis.ds.czbiohub.org/).