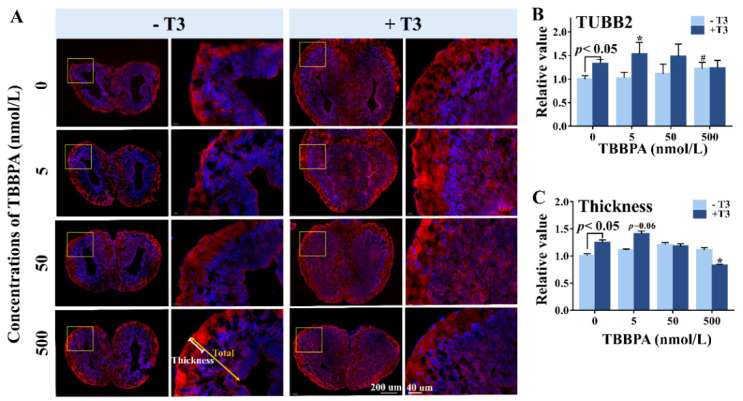
Figure 5.
The effect of TBBPA on neurodifferentiation in the brain of NF stage 52 Xenopus laevis tadpoles exposed to a series of concentrations of TBBPA in the absence or presence of 1 nmol/L T3. (A) the immunofluorescence images of telencephalons retained TUBB2 (red) and DAPI (blue). (B) the relative fluorescence intensity of TUBB2, normalized by the control group. (C) The relative thickness of the outer neuropil. The data were normalized by the mean value of the solvent control. Data are shown as mean ± SD. # indicates significant differences between TBBPA treatment and solvent control treatment (p < 0.05). * indicates significant differences between TBBPA + T3 treatment and T3 treatment (p < 0.05). The experiment was repeated three times using tadpoles from different sets of adults. The results were consistent among the three independent experiments.

