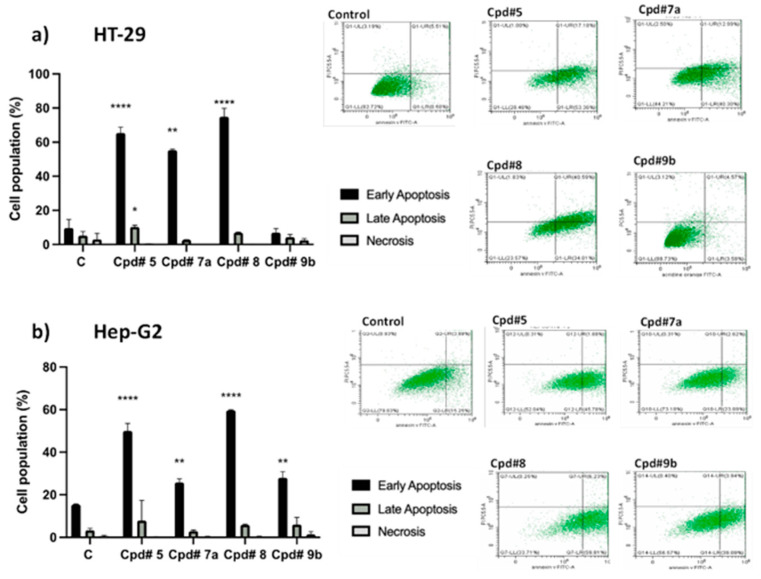
Figure 5.
Apoptosis/necrosis assessment in HT-29 (a) and HepG-2 (b) cells after exposure to the synthesized compounds. Cells were exposed to predetermined IC50 of compounds 5, 7a, 8, and 9b for 24 h and were stained with annexin V-FITC/PI. Cell populations were plotted as percentage of total events. Data is presented as mean ± SD; n = 3. * Significantly different from the control group at p < 0.05. ** Significantly different from the control group at p < 0.005 **** Significantly different from the control group at p < 0.0001.

