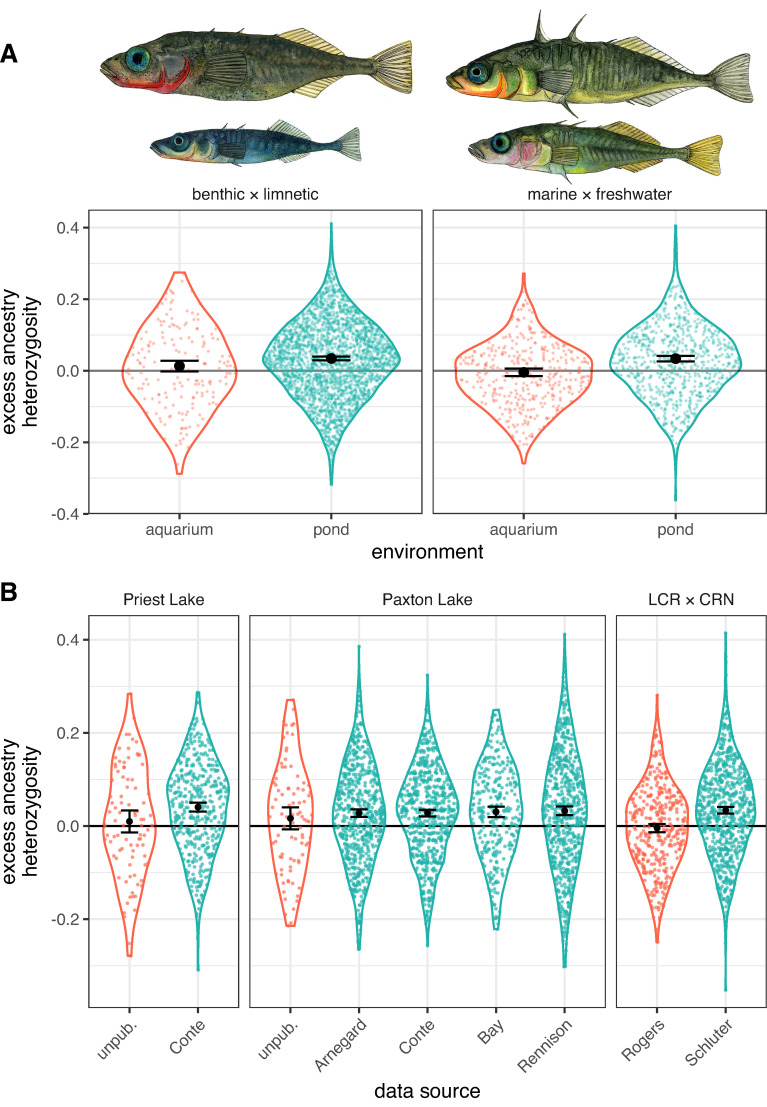
Fig 2. Excess ancestry heterozygosity in recombinant threespine stickleback hybrids in the lab (aquarium) and field (pond).
Panel (A) shows the main test of group differences for (left) benthic × limnetic crosses and (right) marine × freshwater crosses. Drawings above the panels were done by K. Chu and show the first listed population on top. These values are extracted from our statistical model using visreg (colored points and violins; [31]) and emmeans (black estimates of means and CIs; [32]). Panel (B) shows raw data (i.e., not from a statistical model) for each data source (Table 1; LCR × CRN is Little Campbell River × Marine) separately, with colors representing lab (red) versus pond (blue) as in (A). Violin overlays show the full distribution of the data, and small colored points show values for individual fish. Large black points are the group means and 95% CIs. The data and code required to recreate this figure may be found at https://doi.org/10.5061/dryad.h18931zn3.

