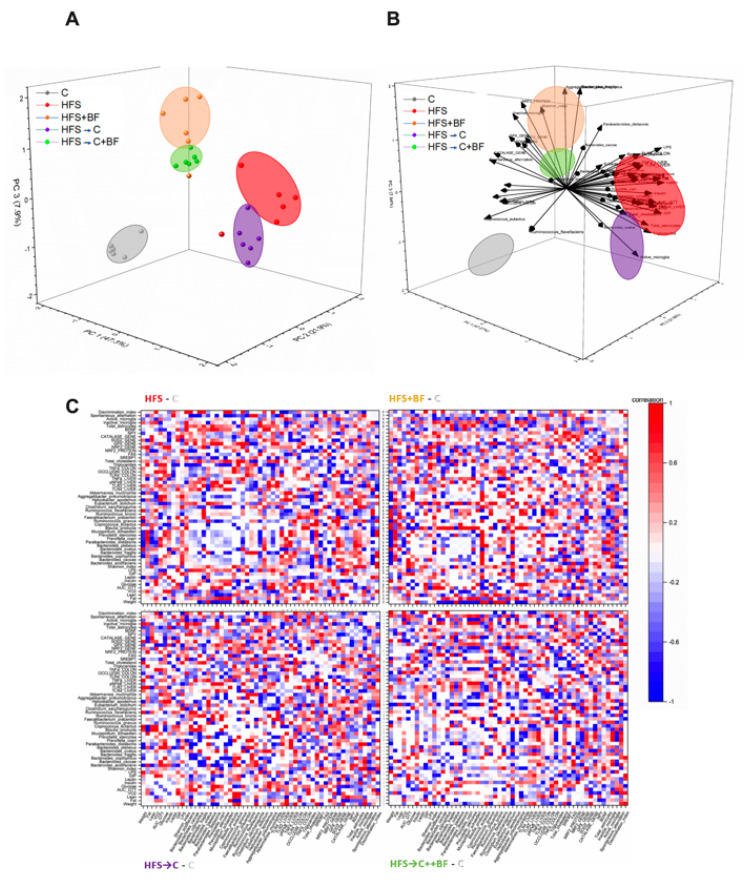
Figure 12.
Association between biochemical parameters in liver and brain with the gut microbiota. (A) PCA_scores: Principal components 1, 2, and 3. Each dot corresponds to each subject, ellipse is the best fitting for each group (which includes 80% of the data). (B) Loading plot. Vector of each data variable on the first three principal components. Each ellipse corresponds to each group studied, (C) Correlation_difference. Normalized differences between correlation matrix of each group minus the C group correlation matrix of all the variables. White corresponds to the same correlation between variables, red is maximum change, and blue indicates negative difference.

