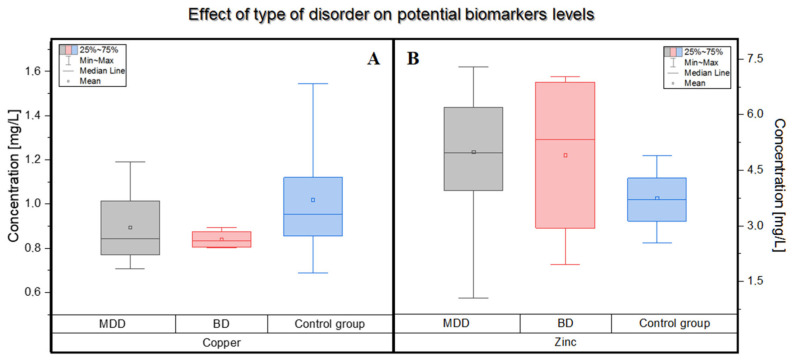
Figure 2.
Differences in the concentration of copper and zinc in the blood of patients suffering from BD (pink, n = 4) and MDD (grey, n = 11) compared to the control group (blue, n = 15). The mean (circle), median (line), percentile 25, 75 (boxes), and minimum and maximum value (whiskers) are shown in both figures. (A) Box plot showing the influence of type of disease or no disease on the concentration of copper. (B) Box plot showing the influence of the type of disease or no disease on the concentration of zinc.

