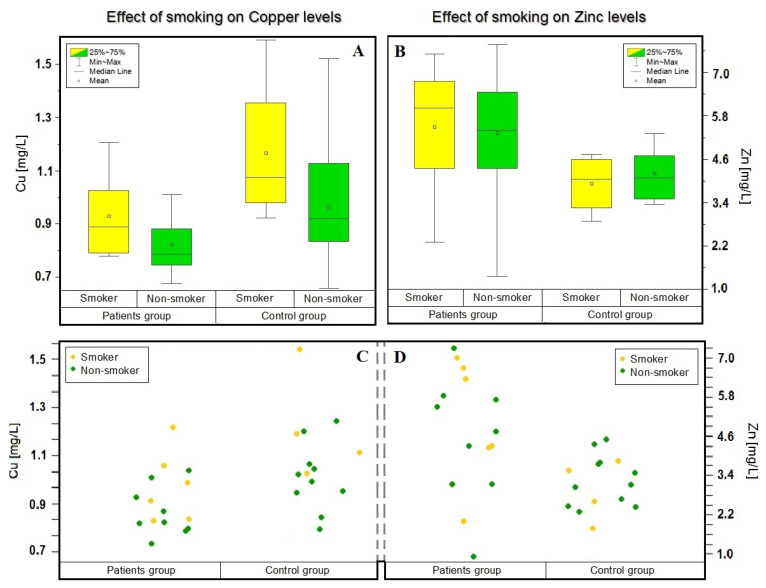
Figure 3.
Dependence of the concentration of zinc and copper in the blood of patients and the control group depending on the selected criterion—smoking (In patient group: smoker—yellow; n = 6, non-smoker—green; n = 9. In control group: smoker—yellow; n = 4, non-smoker—green; n = 11.). The mean (circle), median (line), percentile 25, 75 (boxes), and minimum and maximum value (whiskers) are shown in (A,B). (A) Box plot showing the influence of smoking on the concentration of copper. (B) Box plot showing the influence of smoking on the concentration of zinc. The visualizations in (C,D) were inspired by the t-test, i.e., they are an attempt to compare the means of two finite research samples with selected criteria. (C) Shows visualizations of the distribution of copper concentrations considering the smoking criterion. (D) Shows visualizations of the distribution of zinc concentrations considering the smoking criterion.

