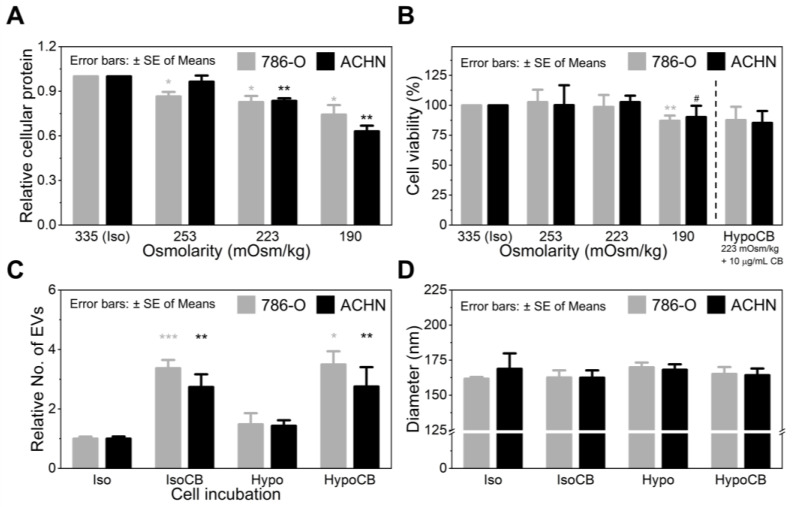
Figure 3.
The effect of hypo-osmotic pressure on (A) amount of total cellular protein (n = 8), (B) cell viability (n = 4), (C) EV production (n ≥ 3), and (D) size of the produced EVs (n ≥ 3). Significance levels are indicated as # p < 0.10, * p < 0.05, ** p < 0.01, and *** p < 0.001, compared to the non-CB treated cells.

