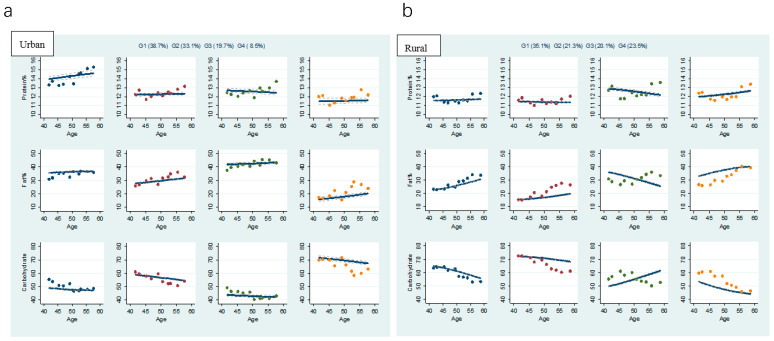
Figure 2.
Multi-trajectories of Protein%, Fat%, and Carbohydrate% among Chinese adults by urban (a) or rural (b) residence. Source: CHNS 1991–2018. Notes: Solid lines represent the average estimated Protein%, Fat%, and Carbohydrate% (the percentage of energy provided by dietary proteins, fats, and carbohydrates) over time. Dashed lines represent the 95% CI. The dots represent the actual data, where we weighted each individual’s responses based on posterior probabilities of group membership.

