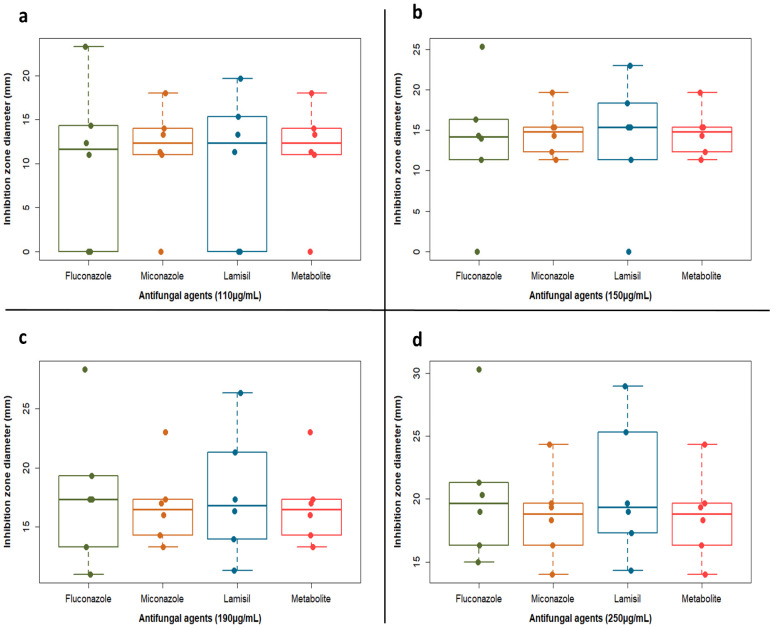
Figure 3.
Boxplots showing inhibition zone diameter (mm) vs. antifungal agents (fluconazole, miconazole, Lamisil and the active metabolite) at different concentrations: (a) 110 µg/mL, (b) 150 µg/mL, (c) 190 µg/mL and (d) 250 µg/mL. Dots representing each sample were overlaid to show the actual variability and distribution of the data. Plot was created by R (“ggplot2”) package.

