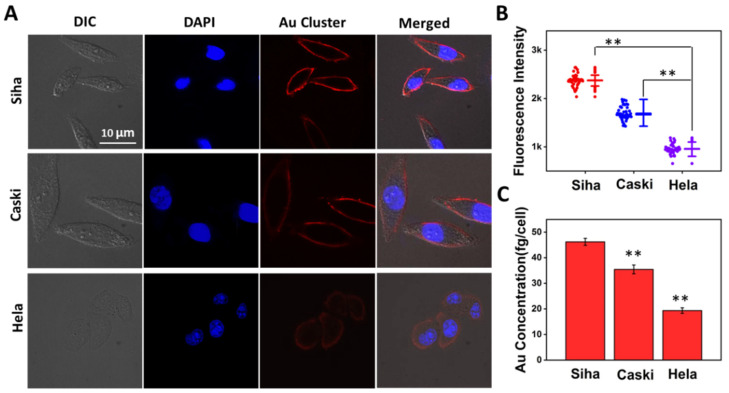
Figure 6.
Quantitatively distinguish cervical cancer cells with different invasion/metastasis capabilities. (A) Human cervical cancer Siha, Caski and Hela cells were exposed to 8 μM Au clusters for 0.5 h. (B) Fluorescence intensity analysis corresponds to A. Data on the left cell line represent the fluorescence intensity for each of the 50 cells selected, and data on the right represent the average fluorescence intensity and standard deviation for the 50 cells, respectively. (C) The average Au mass on each cell was quantified by ICP-MS. ** p < 0.01.

