
Figure 1.
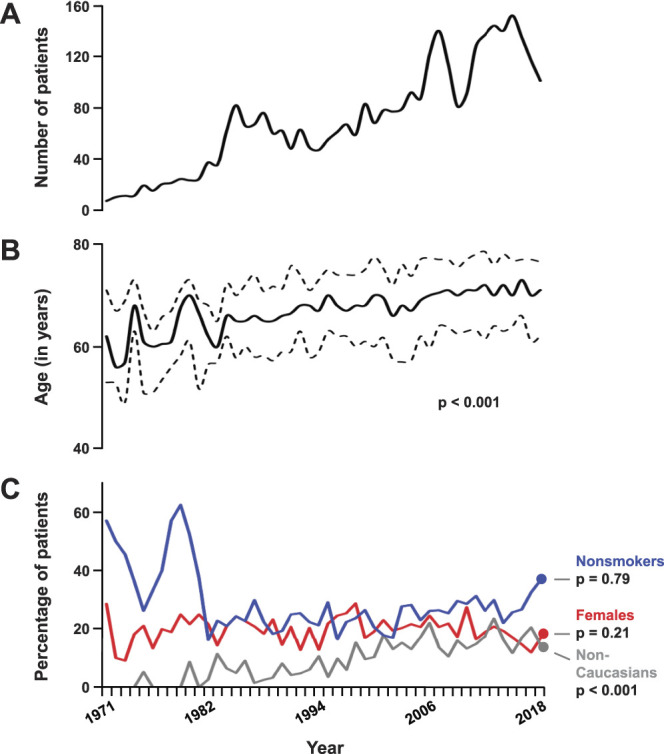
Annualized trends of baseline characteristics of patients with bladder cancer. Line graphs show trends in number of patients (A), median age (solid) with IQR (dotted; B), and proportion of patients who were nonsmokers (blue), females (red) and nonCaucasians (gray; C) across the study duration. Annualized p value calculated by Kruskal-Wallis test for age, and by Mantel-Haenszel test for trend for other categorical measurements.