Figure 1.

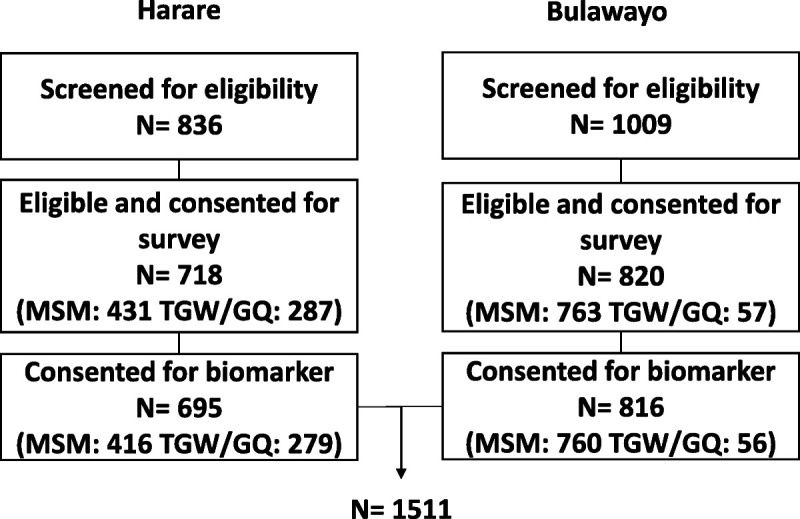
Flowchart of the number of individuals screened for eligibility, number of individuals eligible and consented for survey, and number of participants consented for biomarker testing by city and key population in Zimbabwe, 2019.

Flowchart of the number of individuals screened for eligibility, number of individuals eligible and consented for survey, and number of participants consented for biomarker testing by city and key population in Zimbabwe, 2019.