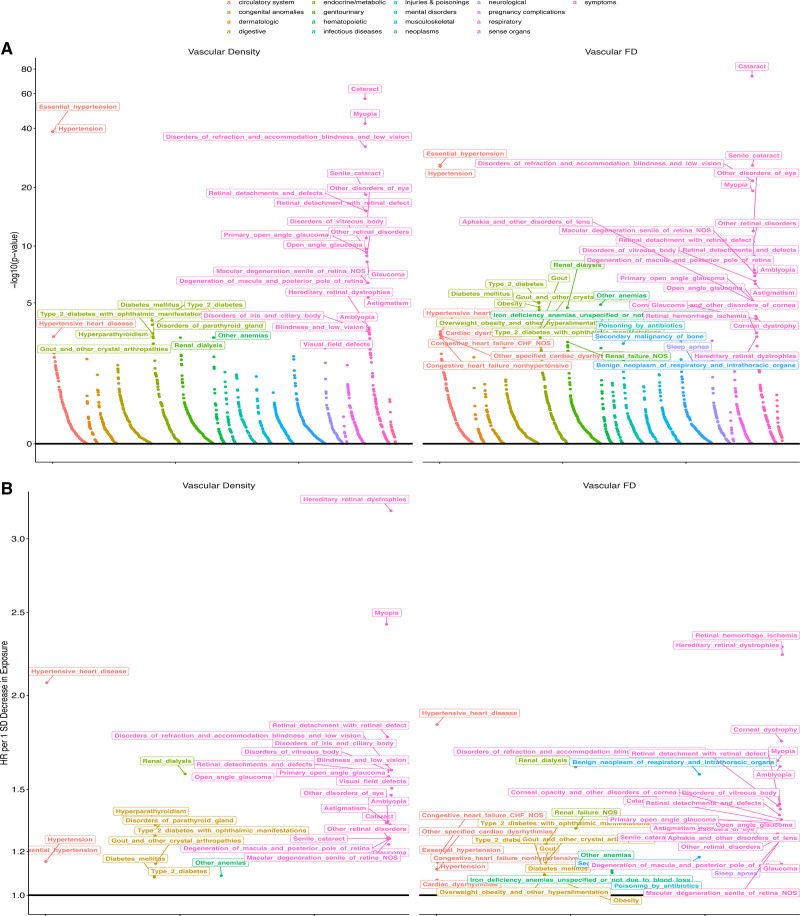
Figure 3.
Phenome-wide associations with incident disease. A, –Log10(P value) of associations of retinal vascular density and fractal dimension (FD) with incident disease plotted as grouped by phenotypic category. Associations were performed with Cox proportional hazards models adjusted for age, age squared, sex, smoking status, and ethnicity. B, Hazard ratio (HR) per 1-SD decrease in either vascular density (left) or FD (right). Labeled phenotypes across both plots have false discovery rate–corrected P<0.05. The x axis reflects an organized grouping of the phenotypes by phenotypic category and P value of association.

