Figure 4.
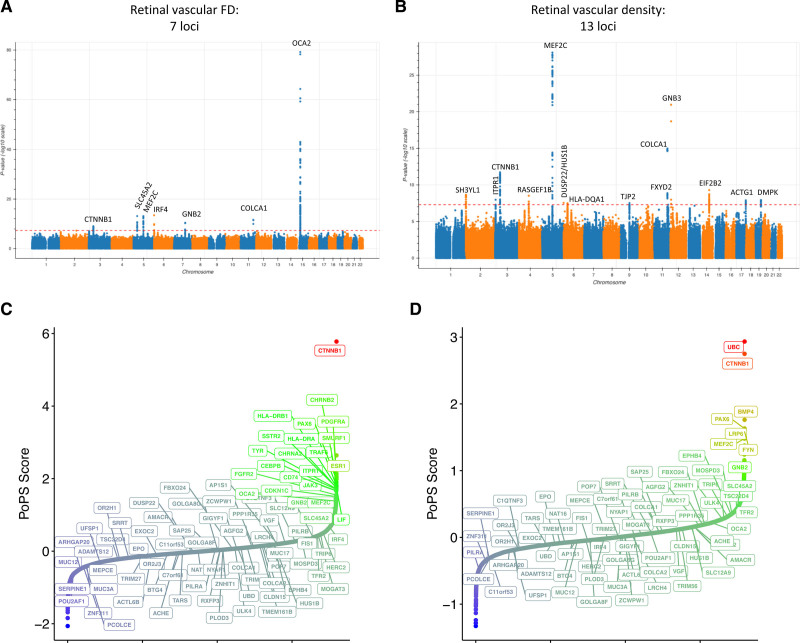
Genome-wide association studies and gene prioritization. A and B, Manhattan plots visualizing the genome-wide association results for retinal vascular fractal dimension (FD; A) and density (B), which identify 7 and 13 loci, respectively. Gene prioritization with the Polygenic Priority Score (PoPS) method.67 C and D, Prioritized genes at each locus (see locus-specific prioritizations in Figure S15). The locus-specific genes prioritized by PoPS at each locus are labeled in A and B. The x axes in C and D are arbitrary and reflect the ordered genes by PoPS score.

