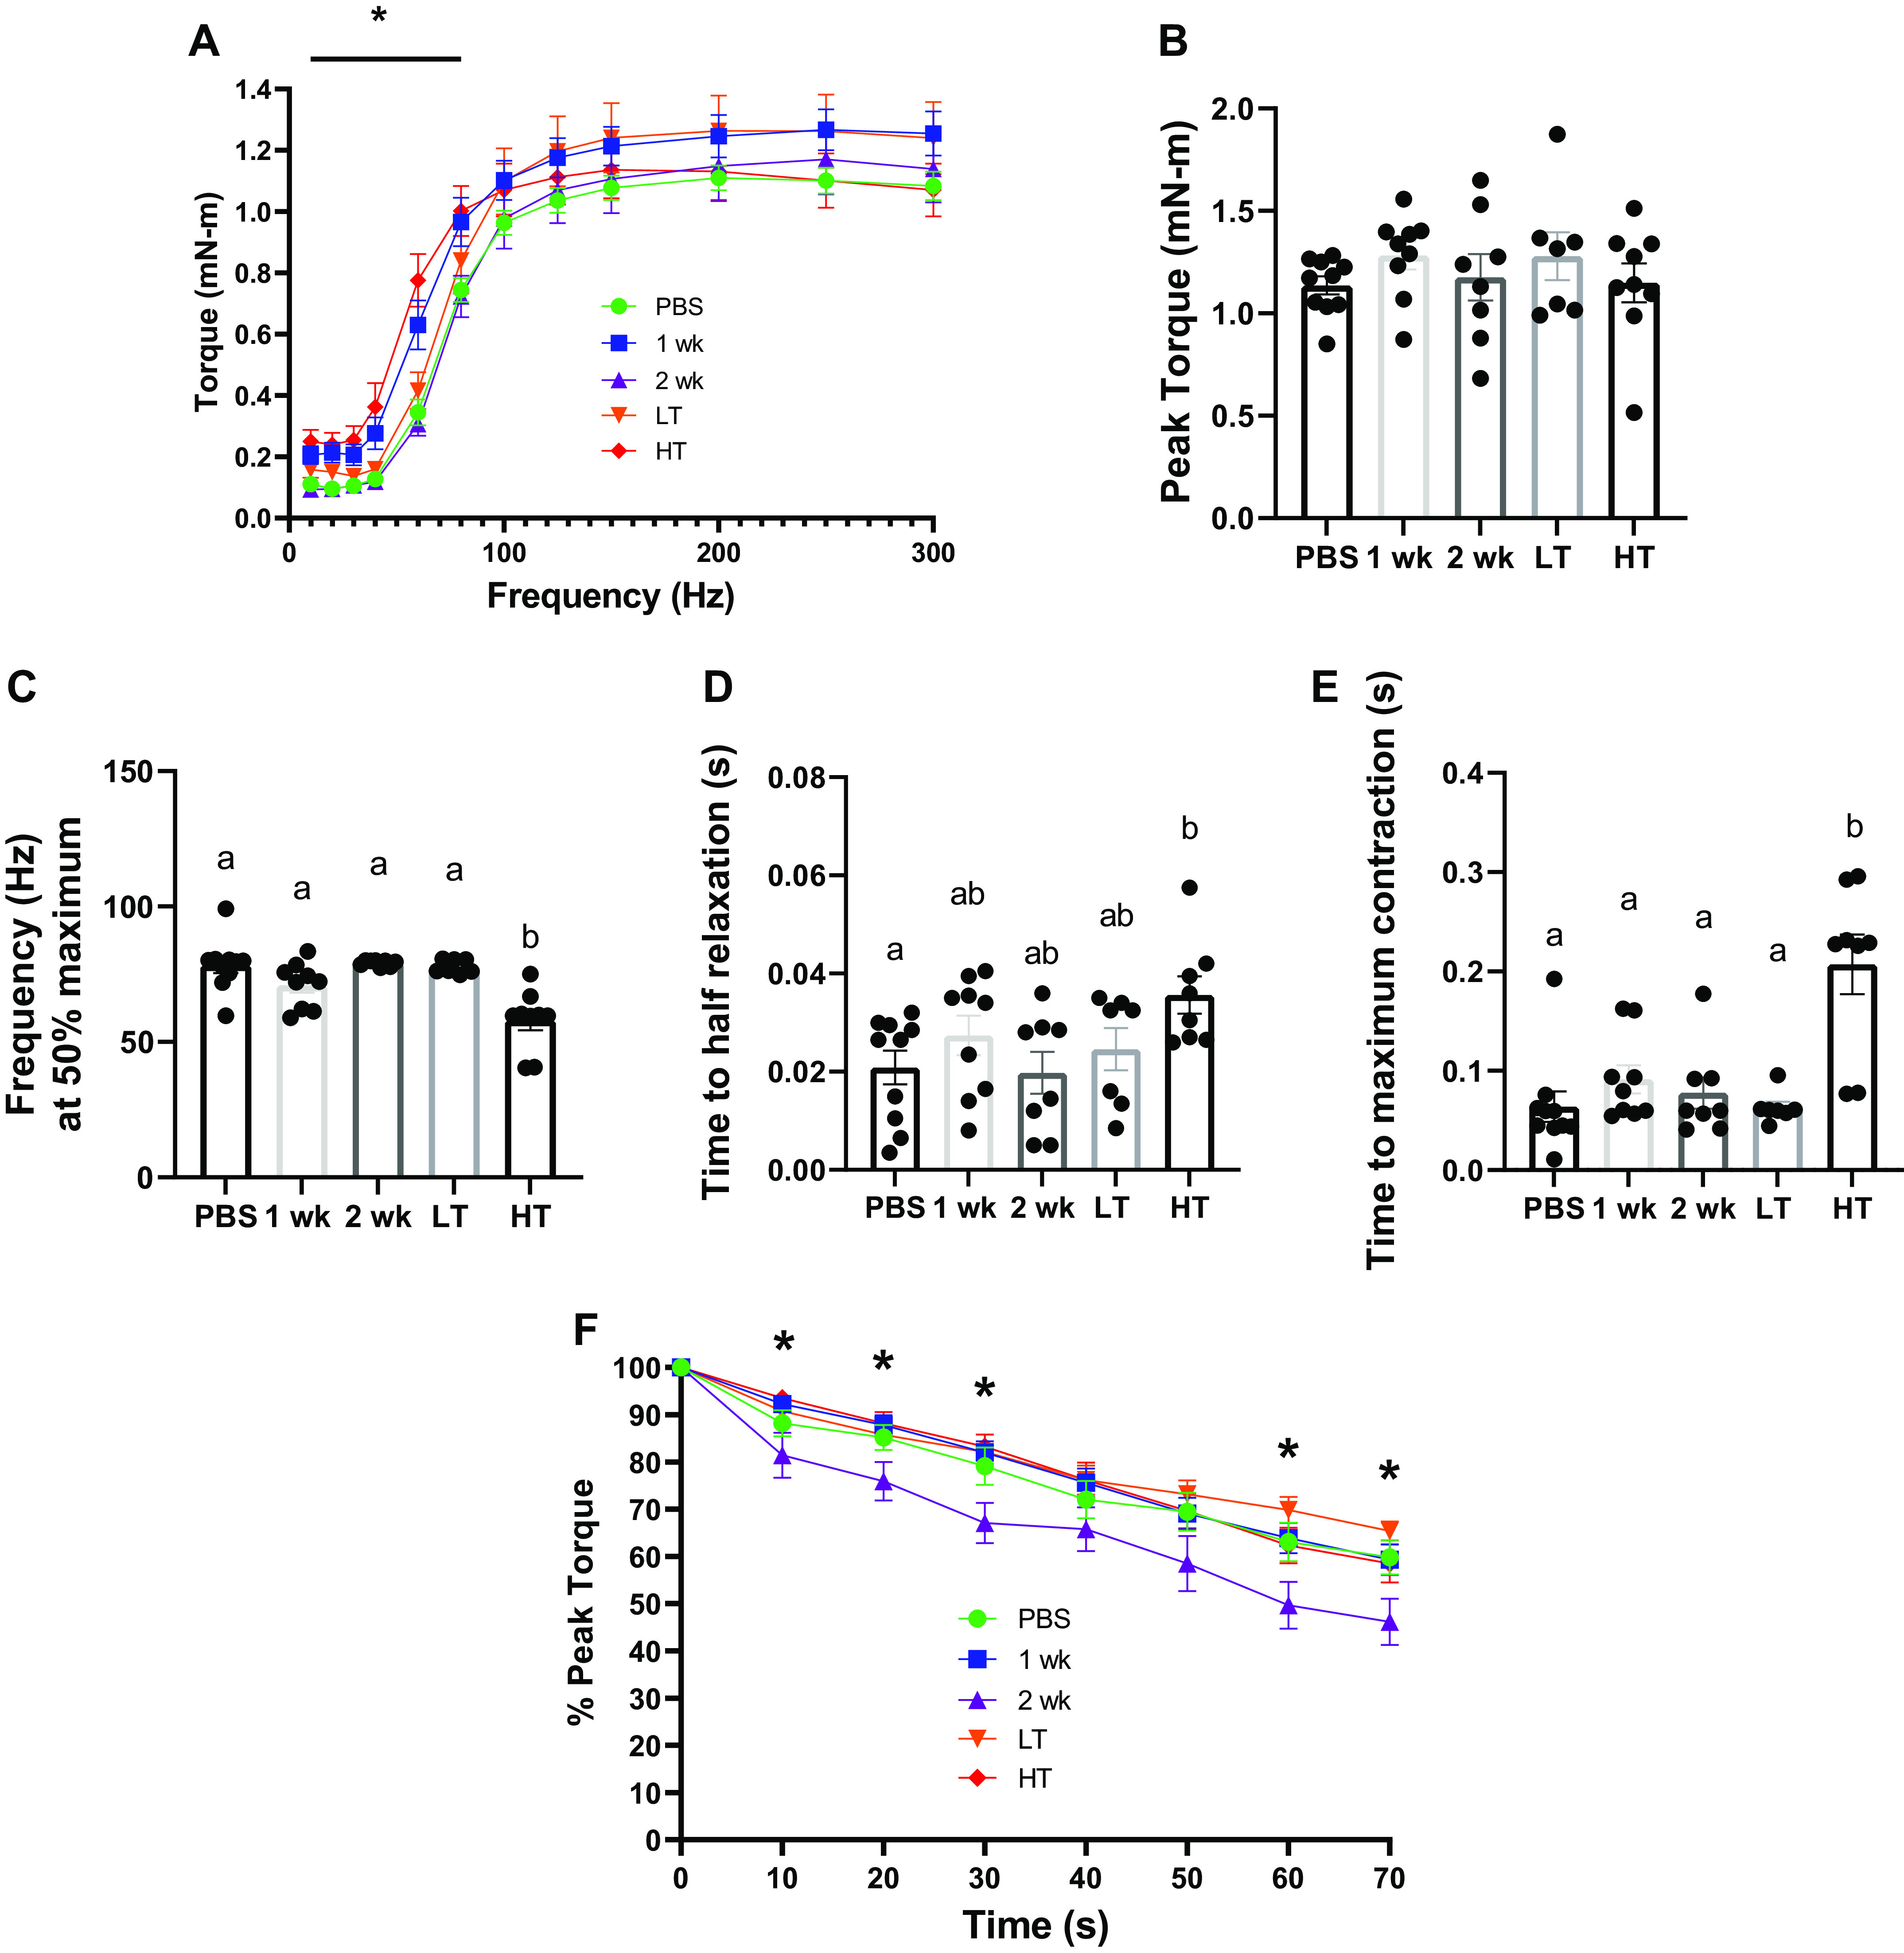
Figure 2.

Skeletal muscle contractility. A: unnormalized isometric torque-frequency curve measured in mN·m for experimental animal groups. B: unnormalized average peak torque (mN·m) across experimental groups. C: frequency (Hz) delivered at 50% maximum torque across experimental groups. D: time (s) for muscle to achieve half relaxation across experimental groups. E: time to maximal contraction (s). F: % peak torque measured over time (s) across experimental groups during fatiguing protocol induced via continuous peroneal nerve stimulation. *Statistical differences observed between experimental groups at P< 0.05. Different letters represent statistical differences at Tukey adjusted with α value set at P ≤ 0.05. n = 7–10 animals/group was used. HT, high tumor; LT, low tumor; PBS, phosphate-buffered saline.
