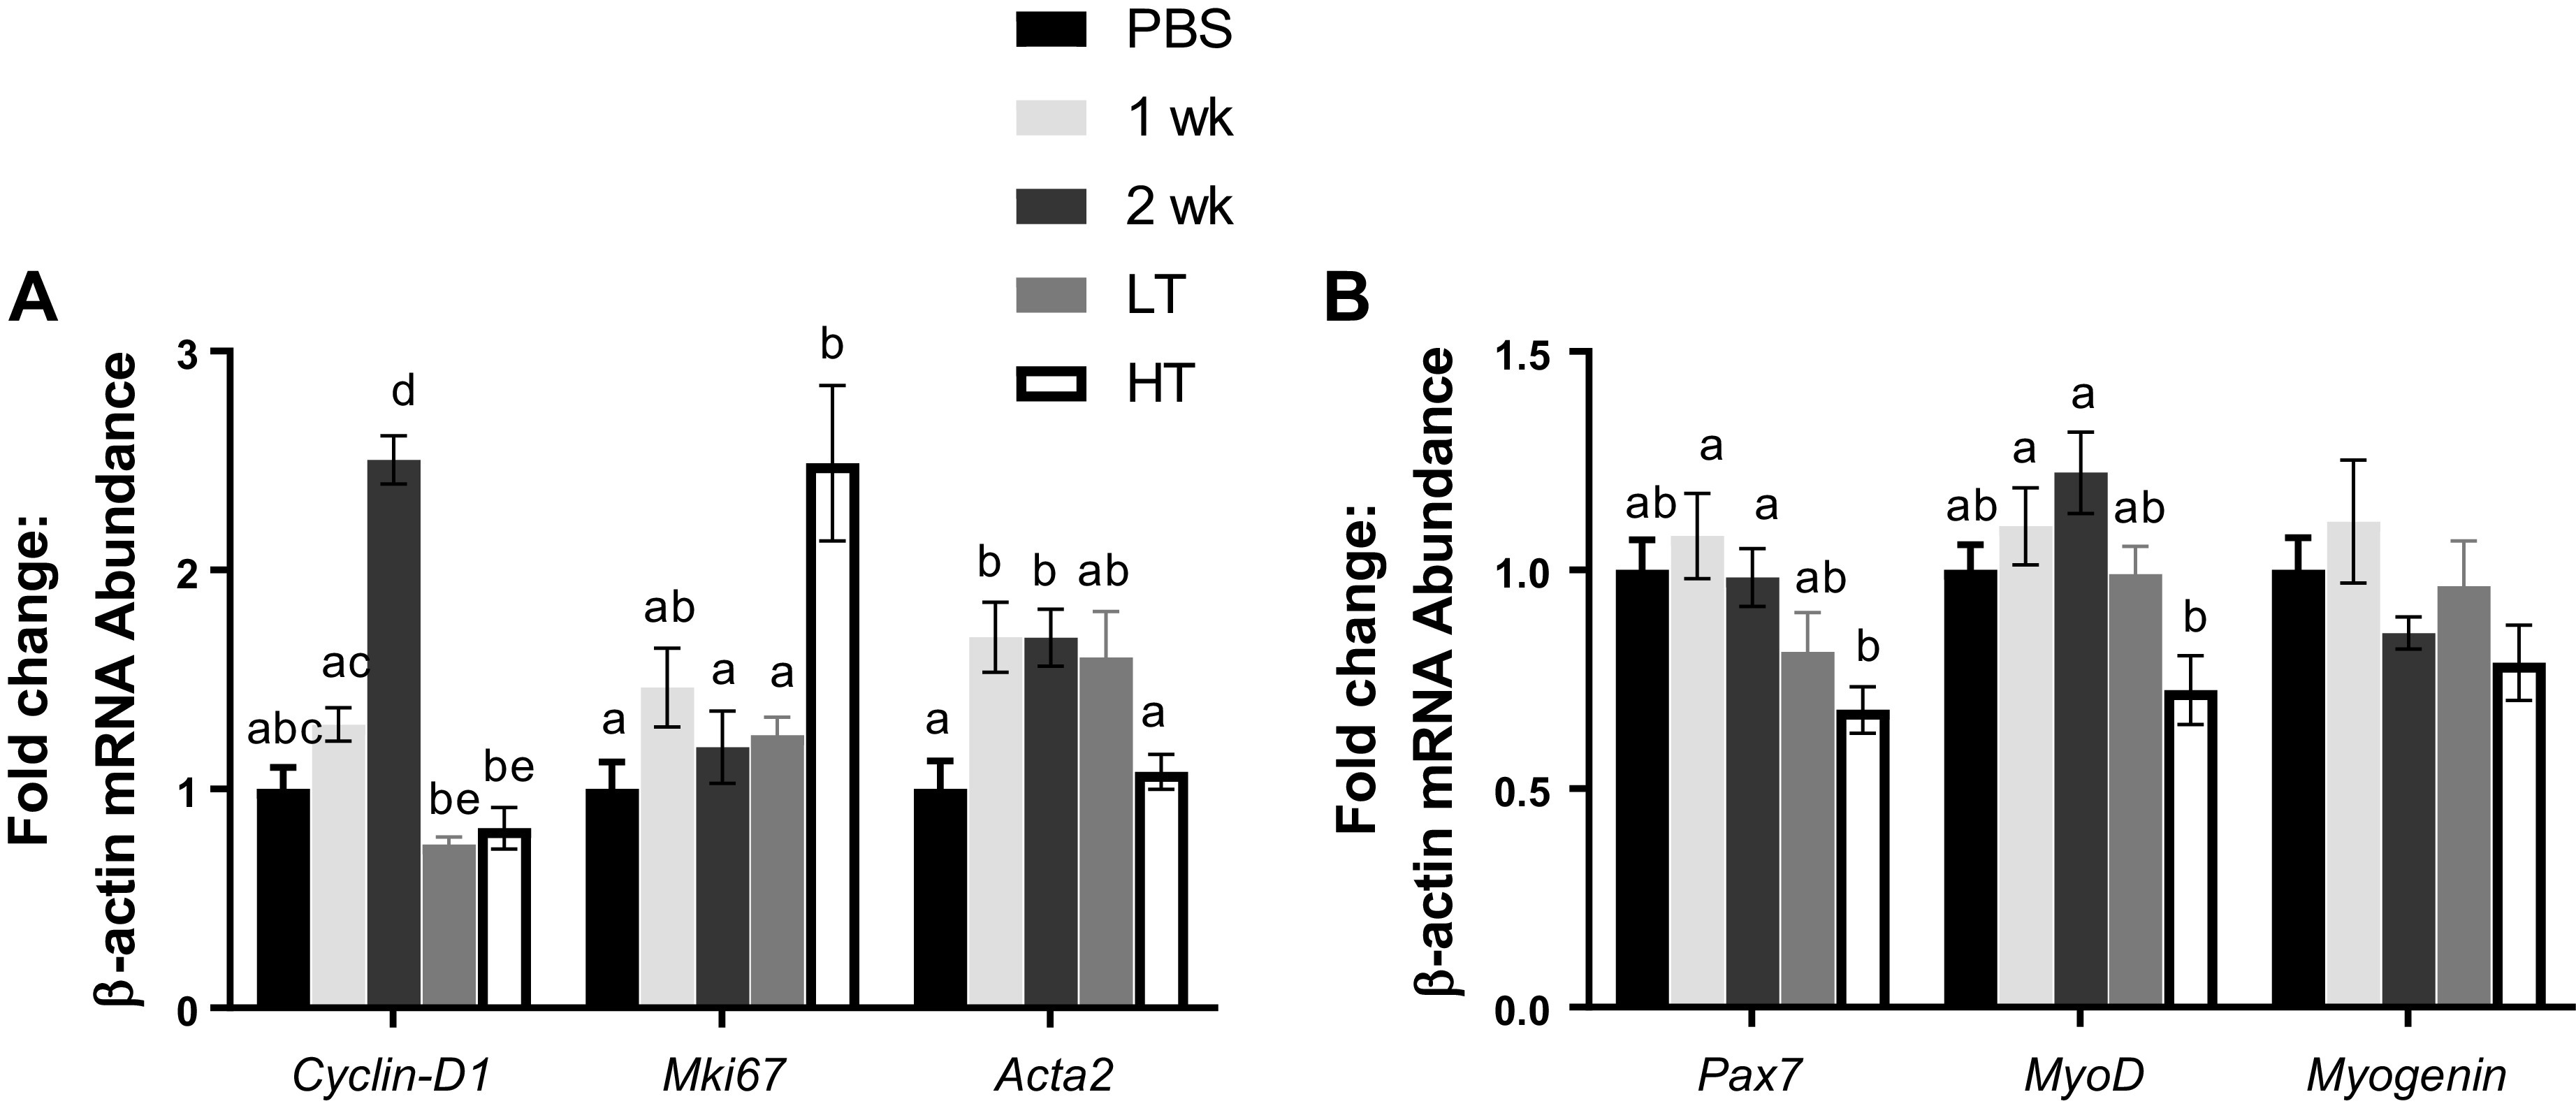
Figure 5.

Myogenic and cell proliferation factors. Cell proliferation (A) and myogenic factors (B) measured for mRNA abundance. A: mRNA abundance measured for Cyclin-D1, Mki67, and Acta2. B: mRNA abundance measured for Pax7, MyoD, and Myogenin. mRNA contents were analyzed from gastrocnemius muscle. Different letters represent statistical differences at Tukey adjusted with α value set at P ≤ 0.05. n = 9–14 animals/group was used. HT, high tumor; LT, low tumor; PBS, phosphate-buffered saline.
