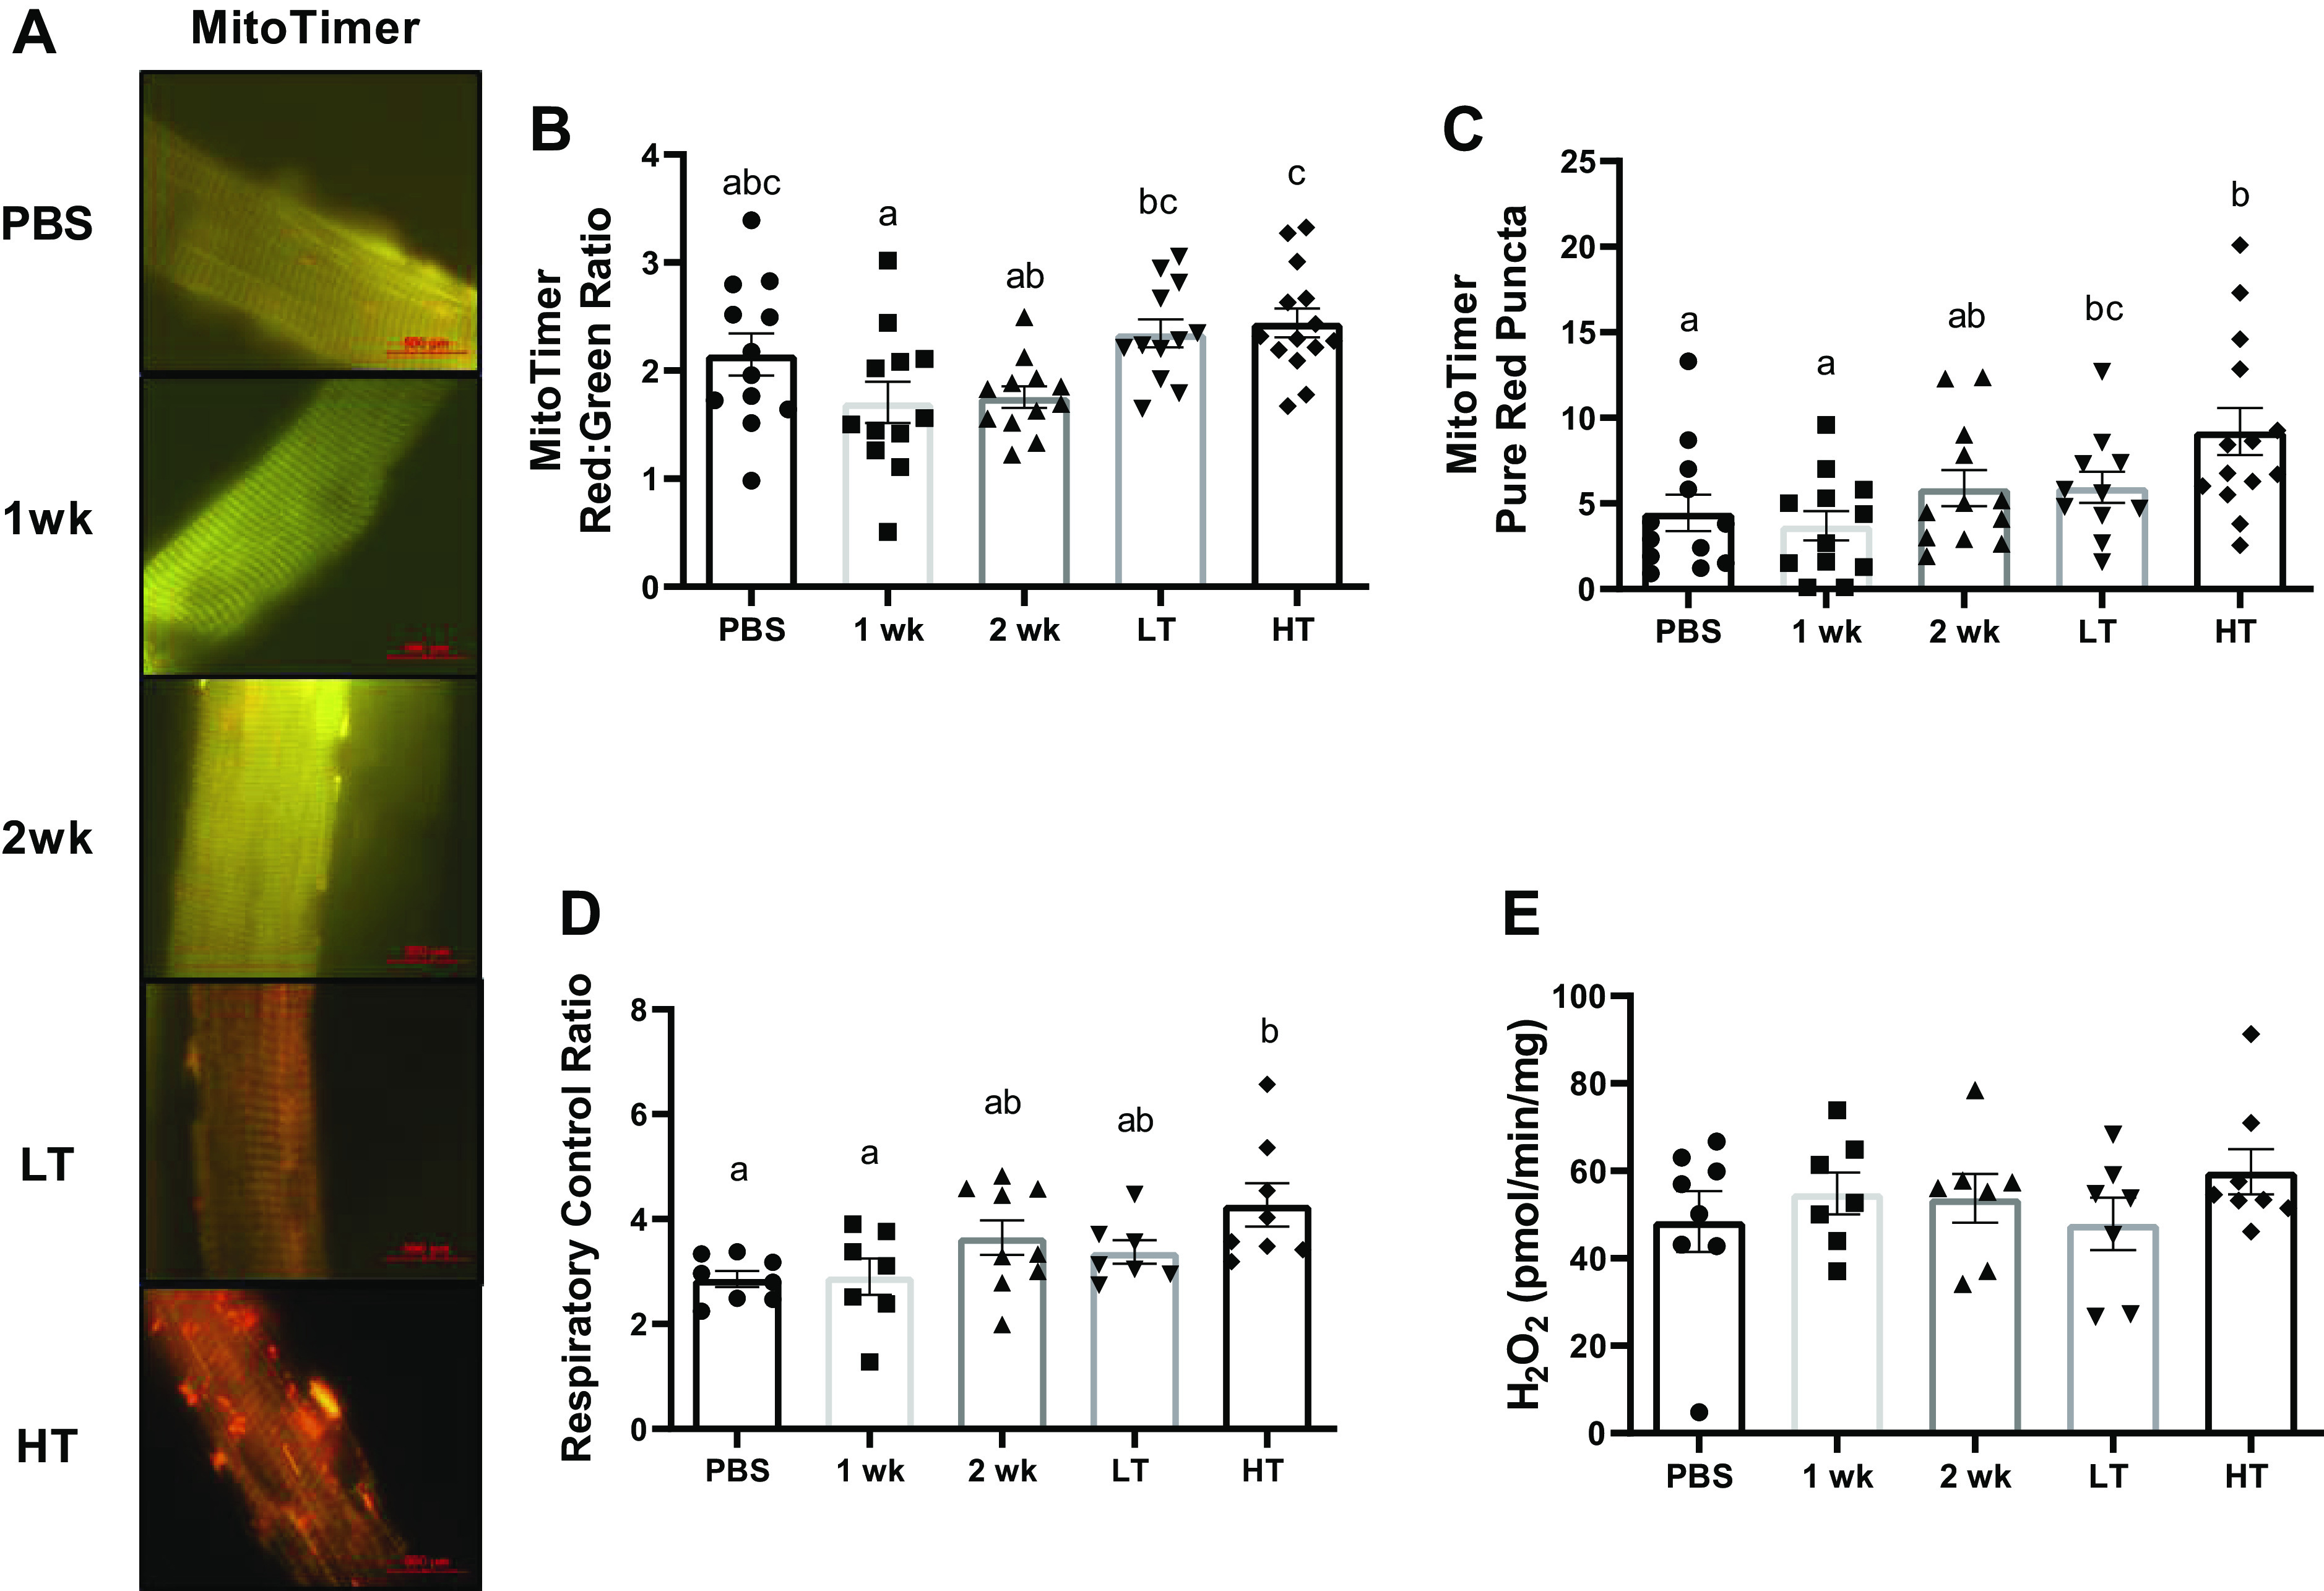
Figure 6.

Mitochondrial function and network. A: representative images of MitoTimer in the FDB muscle taken at ×100 magnification. Scale bar set at 100 µm. B and C: quantifications of MitoTimer in FDB muscle. Quantification of red-to-green ratio (B) and pure red puncta numbers quantified for MitoTimer (C). Pure red puncta are representative of mitochondria that are marked for autophagy. D and E: mitochondrial function and mtROS emission measurements of the plantaris muscle. Respiratory control ratio (D; state 3:state 4 respiration) and H2O2 emission (E) of mitochondria measured with permeabilized plantaris. Different letters represent statistical differences at Tukey adjusted with α value set at P ≤ 0.05. n = 7–9 animals/group was used. FDB, flexor digitorum brevis; HT, high tumor; LT, low tumor; mtROS, mitochondrial reactive oxygen species; PBS, phosphate-buffered saline.
