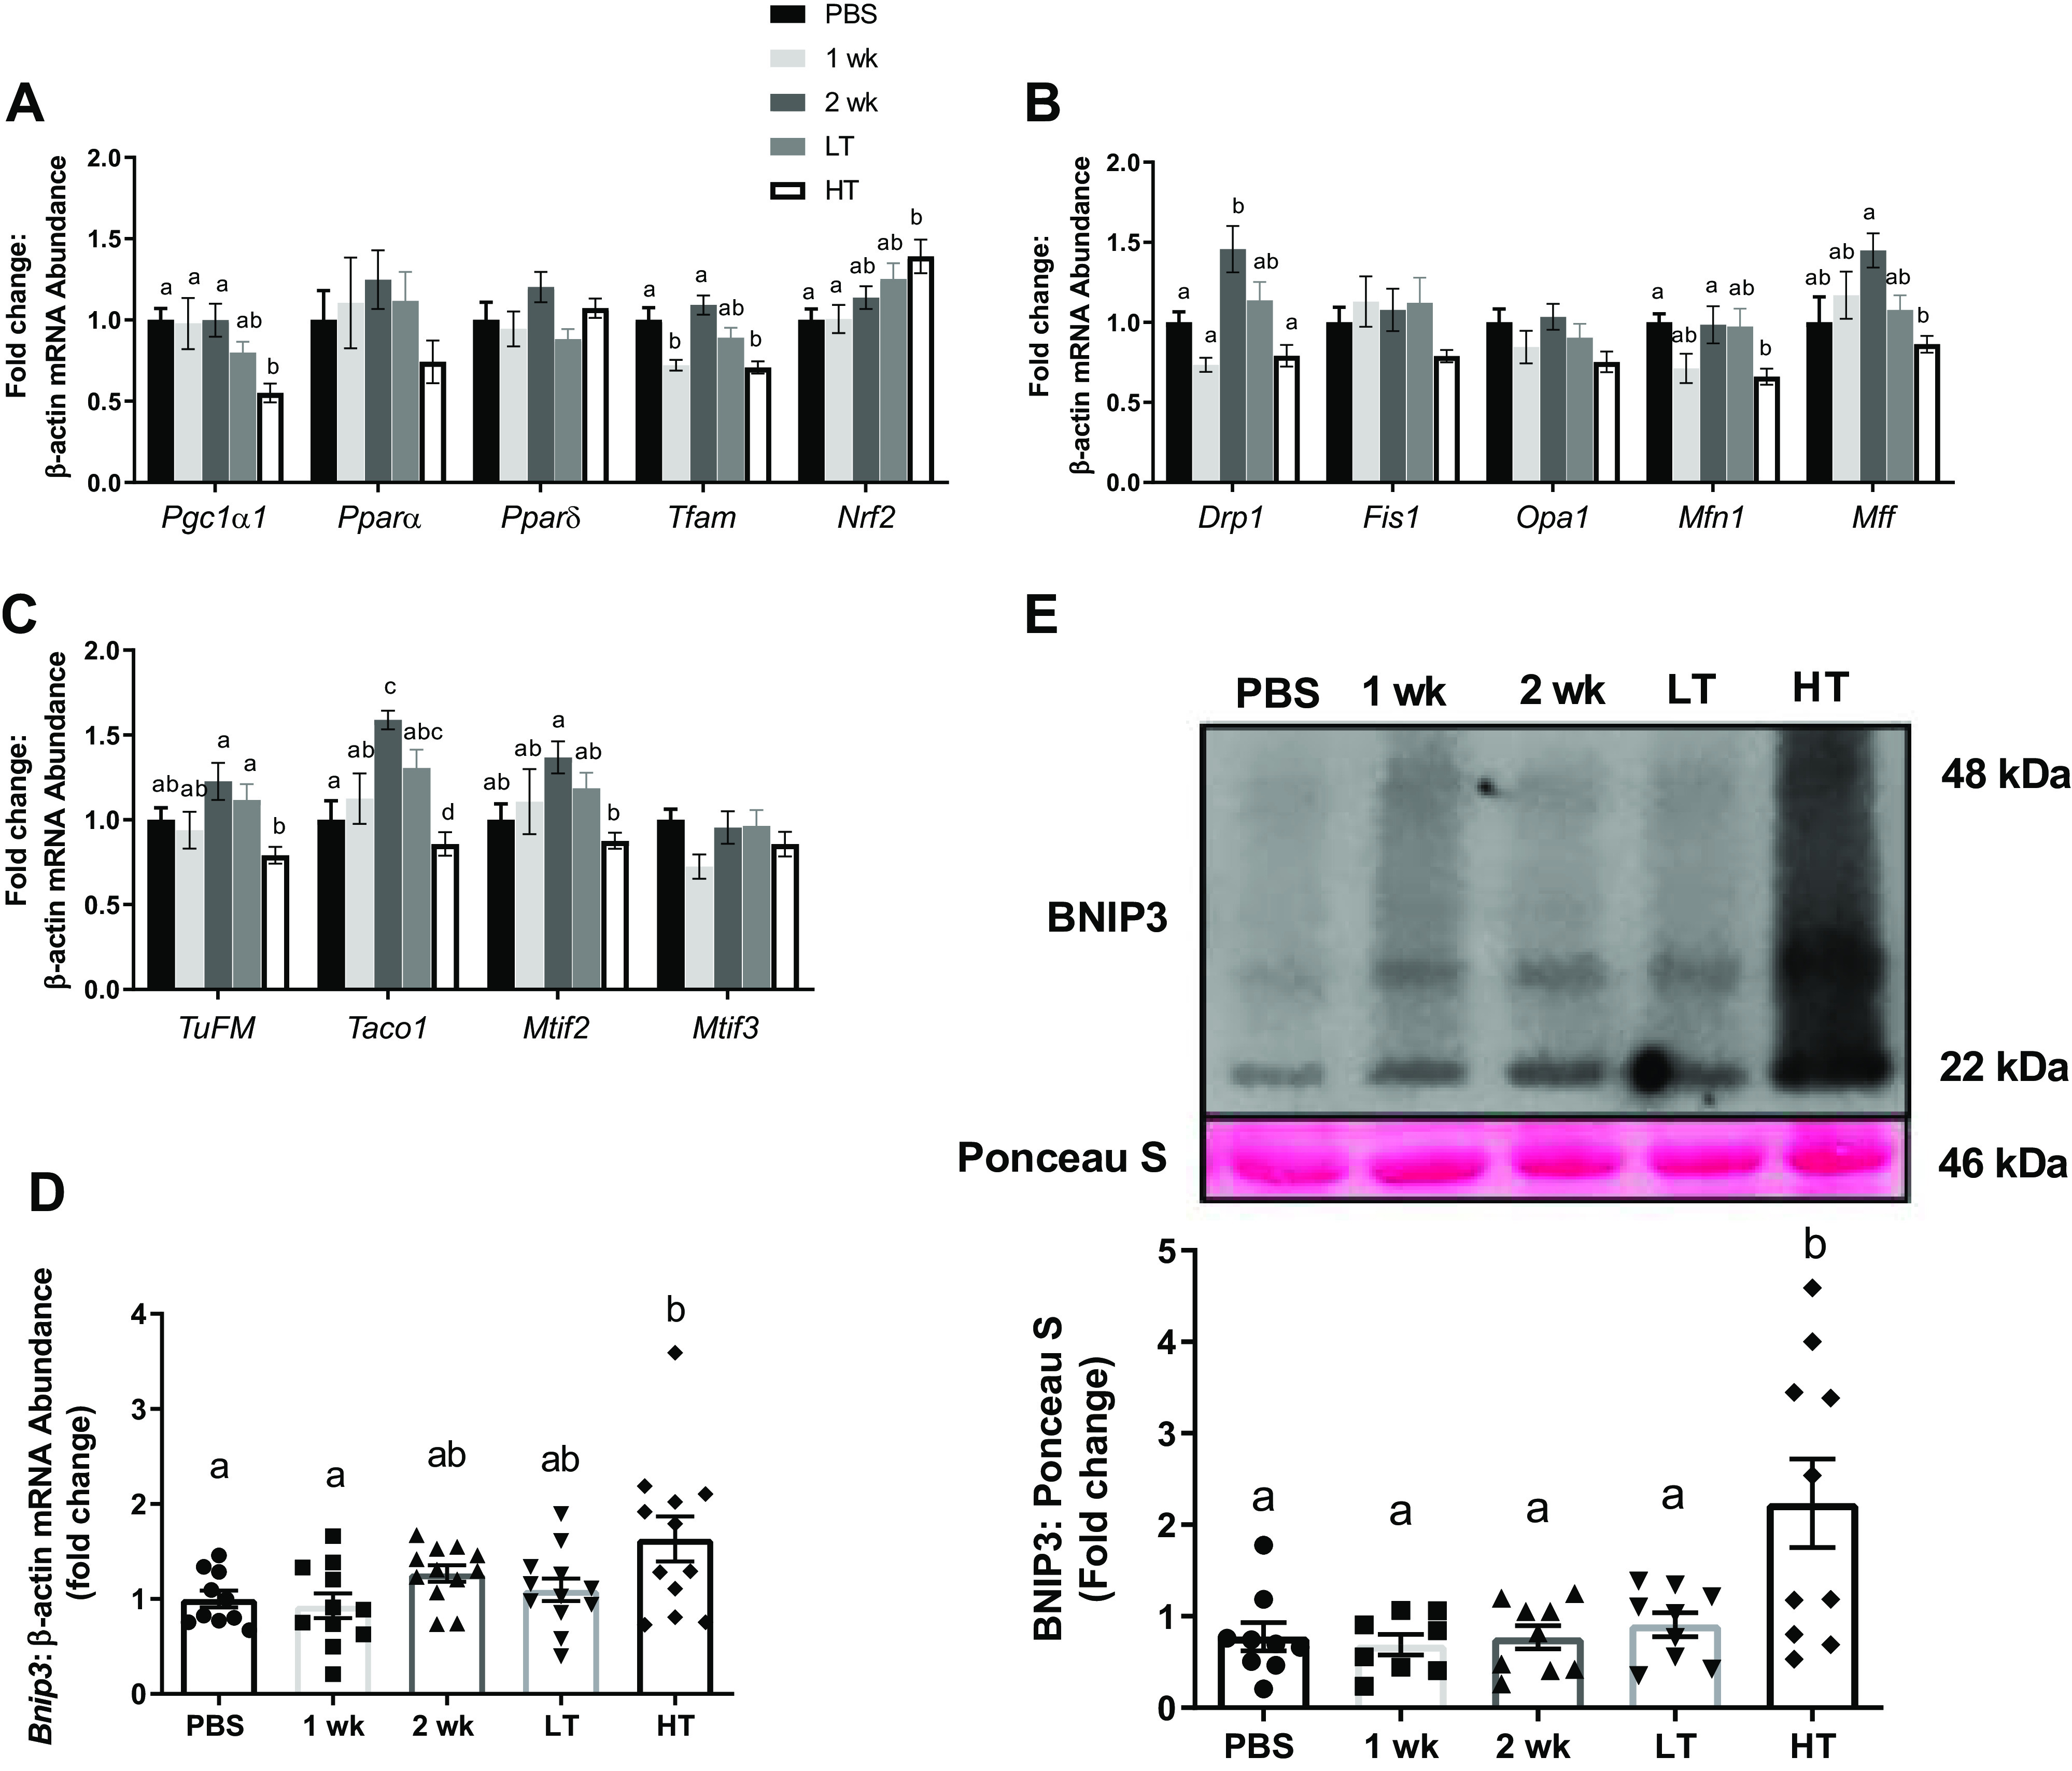
Figure 7.

Mitochondrial quality control. A: mRNA abundance of mitochondrial biogenesis controllers for Pgc1α, Pparα, Pparδ, Tfam, and Nrf2 among experimental groups. B: mRNA abundance of mitochondrial dynamic controllers for Drp1, Fis1, Opa1, Mfn1, and Mff among experimental groups. C: mRNA abundance of mitochondrial translation factors for TuFM, Taco1, Mtif2, and Mtif3 among experimental groups. D and E: mitophagy regulator, BNIP3, measured for mRNA abundance (D) and protein content relative to Ponceau S with a representative image of immunoblot for Bnip3 and Ponceau S (E) among experimental groups. Both mRNA and protein contents were analyzed from gastrocnemius muscle. Different letters represent statistical differences at Tukey adjusted with α value set at P ≤ 0.05. n = 10–14 animals/group was used. HT, high tumor; LT, low tumor; PBS, phosphate-buffered saline.
