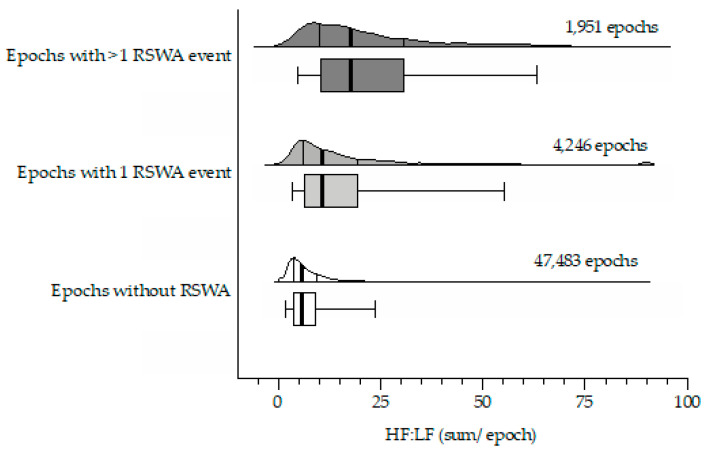
Figure 3.
Epoch-based HF:LF analysis: horizontal violin plots (non-truncated/halved) with corresponding box-whisker plots illustrating the spread across Group E1 (open plot; average HF:LF in all epochs of REM sleep without REM sleep without atonia), Group E2 (light shaded plot; average HF:LF in every epoch of REM sleep with exactly 1 REM sleep without atonia event), and Group E3 (heavy shaded plot; average HF:LF in every epoch of REM sleep with ≥2 REM sleep without atonia events). The heavy solid line corresponds to the median value with the 25th and 75th percentile indicated by the bracketed lines/box outline. Whiskers indicate the 5th and 95th percentiles.

