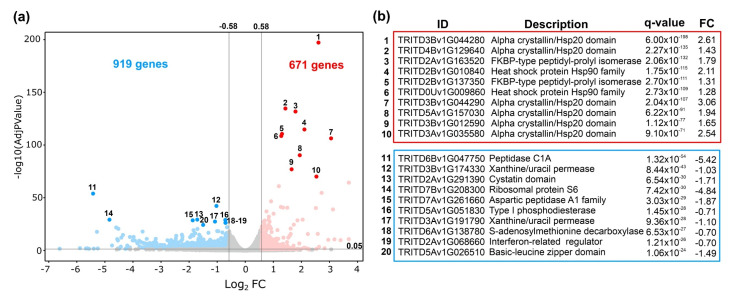
Figure 4.
Volcano plot of differentially expressed genes identified between the heat-stress and control grain samples. (a) The blue dots denote downregulated gene expression (919 genes), the red dots denote upregulated gene expression (671 genes), and the gray dots represent genes under the threshold (q-value < 0.05 and absolute fold of change (FC) > 1.5). Numbers represent the top 10 of down- and upregulated genes. (b) The upper panel (red) shows the ten most significant upregulated genes. Lower panel (blue) the ten most significant downregulated genes. ID: Gene identification from Triticum turgidum durum (Svevo.v1). Description: Gene family. FC: log2 fold of change.

