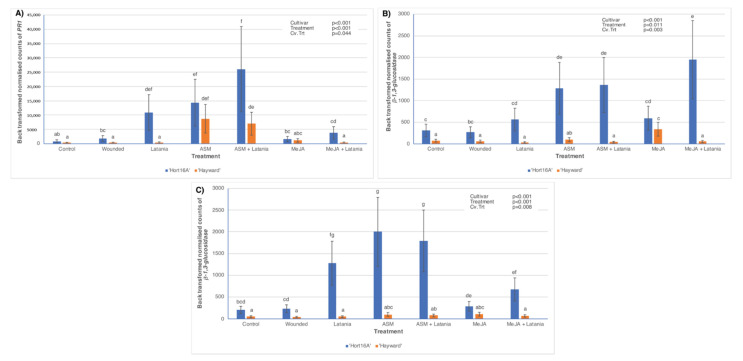
Figure 5.
Defence gene expression measured by PlexSet® NanoString in ‘Hort16A’ and ‘Hayward’ kiwifruit leaf tissue, in 2018, of salicylic acid (SA) pathway-related genes: PR1, at seven days post scale infestation (psi) in (A); and β-1,3-glucosidase, at two days and seven days psi in (B) and (C) respectively. Treatments are described in full in Figure 2. Although leaves were sampled from both two and seven days psi for gene expression measurements, only the statistically significant cultivar × treatment interactions (Cv.Trt) are presented. There were five replicate plants per treatment. The Y-axis represents physical counts of the number of molecules expressed. Statistical analysis necessitated a log2 transformation, but data are presented as back-transformed means ± standard errors. The Y-axis scale is different for each gene. p-values from ANOVA are shown in the top right-hand corner of each bar chart. Different lettering (a–g) indicates statistically significant treatment differences, as shown by LSD, p ≤ 0.05.

