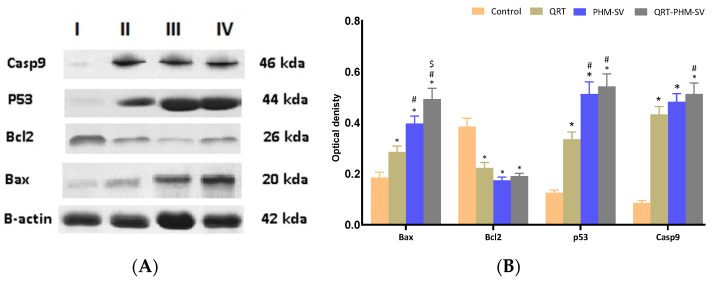
Figure 11.
Western blots (A); histogram of proteins expression of Bax, Bcl2, P53 and Casp9 (B) for the four groups in MCF-7 cells; (I) untreated control; (II) QRT; (III) PHM-SV; (IV) QRT-PHM-SV. * Significantly different from control at p < 0.05; # significantly different from QRT at p < 0.05; $ Significantly different from PHM-SV at p < 0.05.

