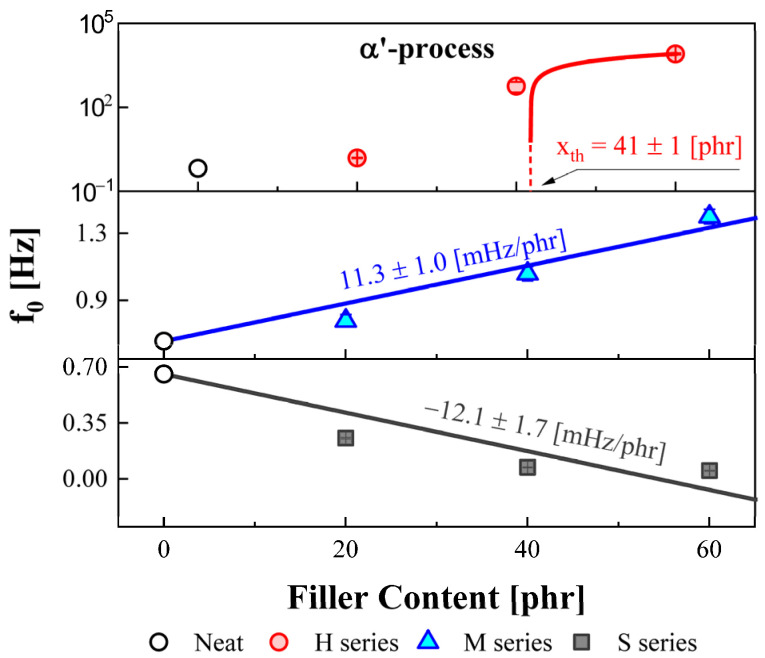
Figure 4.
Variation of the central relaxation frequency for the α′ process with different filler types and contents. The red circle indicates the H series, and the blue triangle and gray square symbols indicate the M and S series, respectively. The red solid line indicates that fitting result of Equation (8) and blue and gray solid lines represent the linear fitting results of f0 versus the filler concentration.

