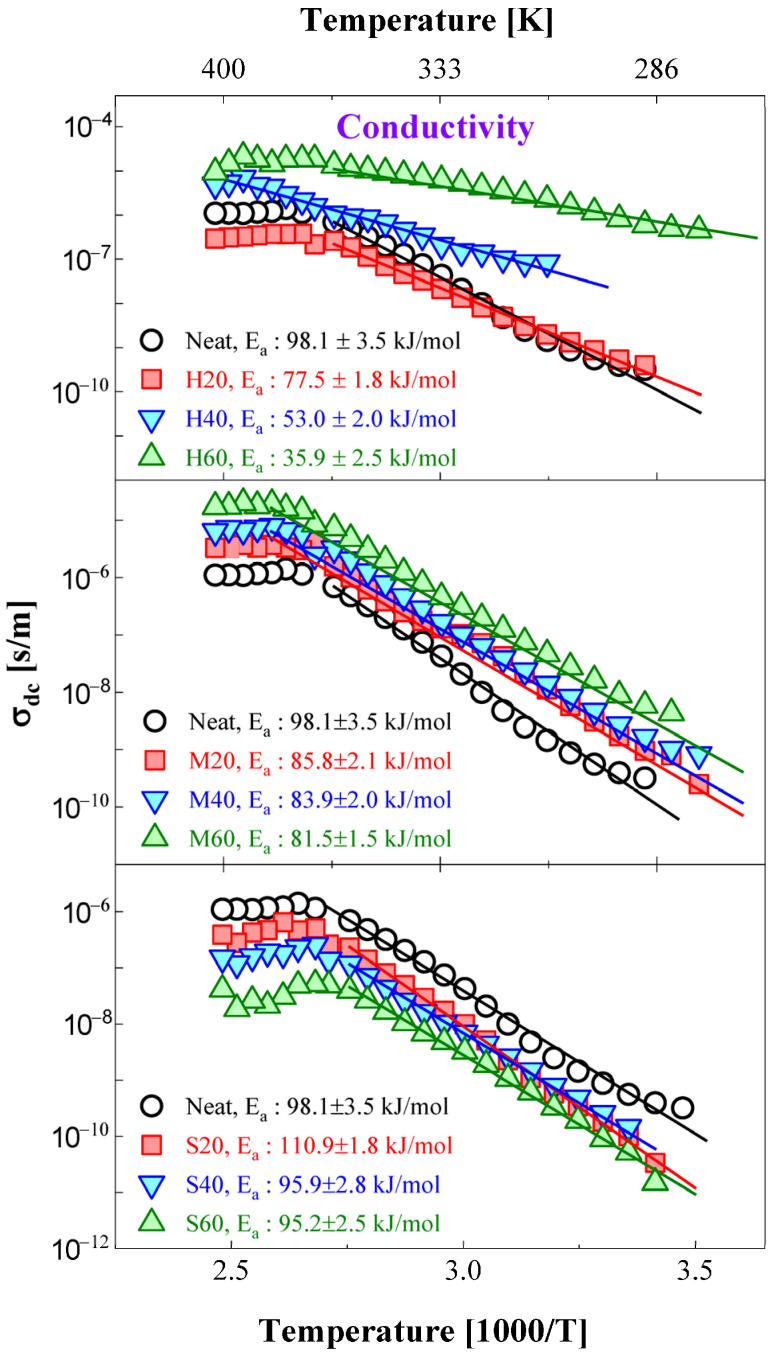
Figure 12.
Temperature dependence of DC conductivity for NBR blends with different filler types and contents. The activation energies for each conduction process were determined to show an Arrhenius temperature dependence, as represented by the solid line. The conductivity data multiplied by arbitrary values can be better distinguished by downshifting on the conductivity axis. For comparison, three identical neat NBR results are shown on the top, middle, and bottom sides of each figure.

