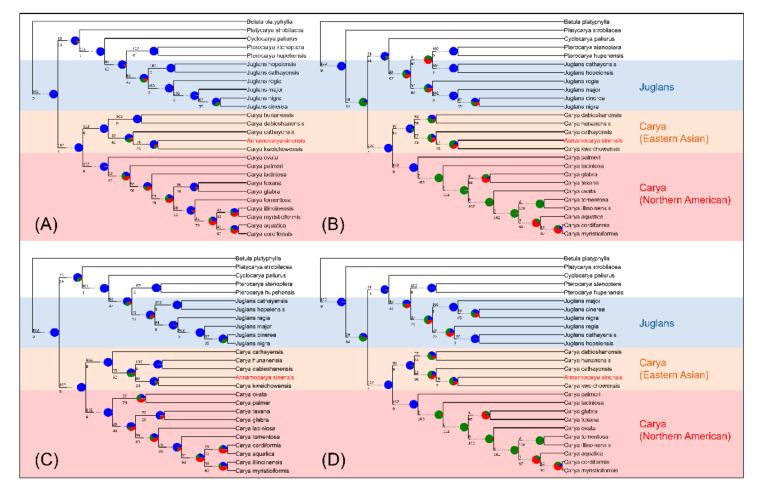
Figure 6.
Phylogeny analysis based on the coalescence method. (A) Analyzed with entire CDS sequences, final normalized quartet score: 0.954; (B) Analyzed with entire protein sequences, final normalized quartet score: 0.804; (C) Analyzed with unique CDS sequences, final normalized quartet score: 0.948; (D) Analyzed with unique protein sequences, final normalized quartet score: 0.807. The pie chart at each node showed the support of gene trees as the following: concordant with gene trees (blue), most common conflict bipartition (green), other conflicting bipartitions (red) and unsupported with gene trees (grey).

