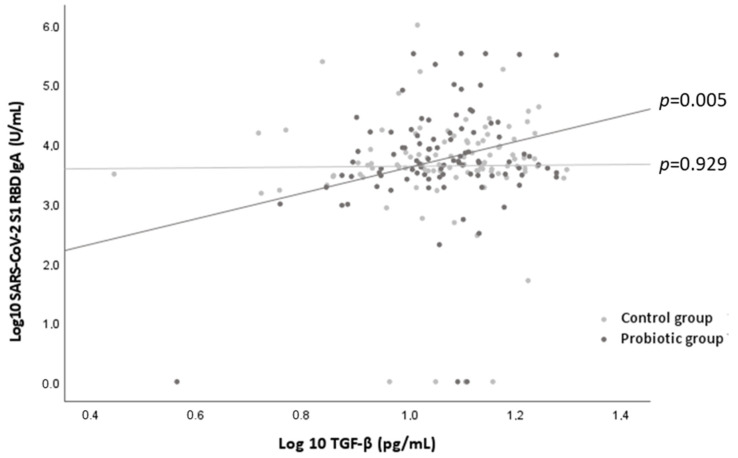
Figure 3.
Relationship between the levels of SARS-CoV-2 S1 RBD IgA (represented in Log10 of U/mL) and levels of TGF-β (represented in Log10 of pg/mL) by control group (light grey points) and probiotic group (dark grey points). p values indicated the statistical significance of the linear regression analysis by intervention group adjusted by age, sex, and disease index.

