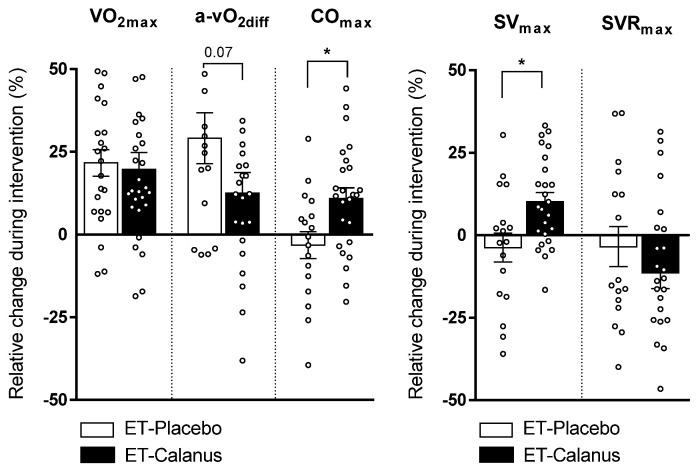
Figure 1.
Individual relative changes in cardiorespiratory parameters during the intervention in ET-Placebo (n = 16–24) and ET-Calanus groups (n = 24–27). Data are presented as mean ± SEM; * p < 0.05 (Mann–Whitney test). VO2max: maximal oxygen consumption; a-vO2diff: peripheral extraction of oxygen; COmax: maximal cardiac output; SVmax: maximal stroke volume; SVRmax: maximal systemic vascular resistance.

