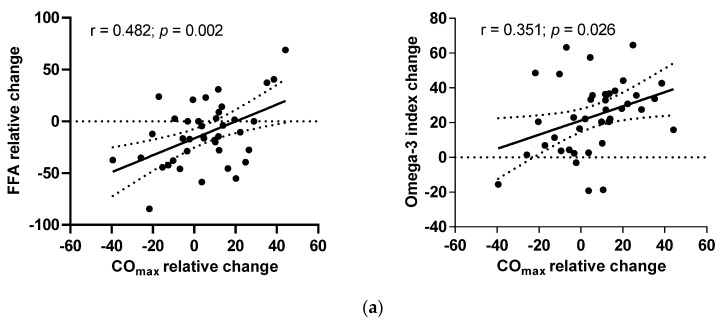
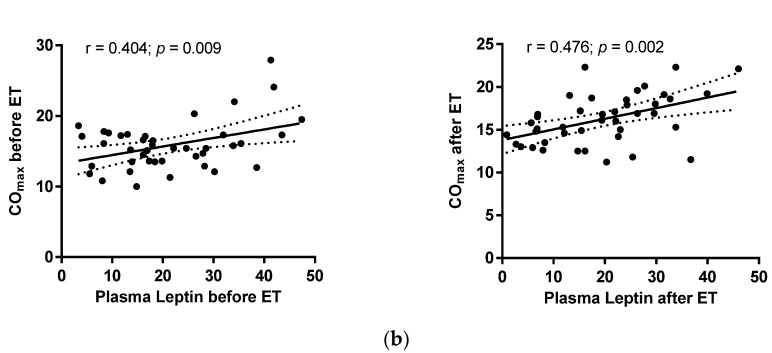
Figure 2.
Correlations of (a) relative changes in maximal cardiac output (COmax) with relative changes in free fatty acids (FFA) in ET-Placebo and ET-Calanus groups during the intervention; (b) COmax with plasma leptin levels before and after the intervention in all subjects. The Pearson’s correlation coefficient is presented (ET-Placebo, n = 16; ET-Calanus group, n = 24).


