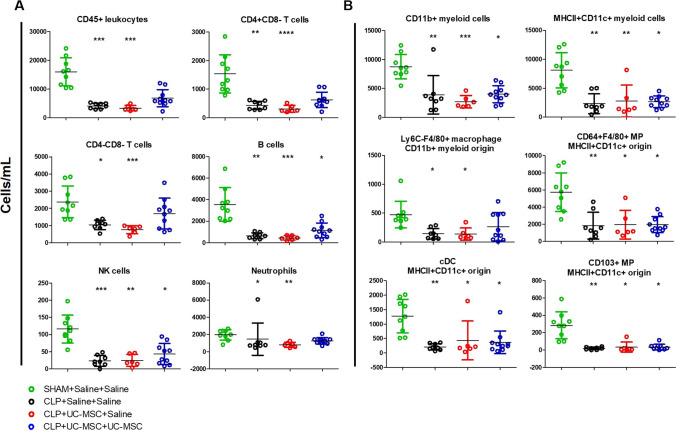
Fig. 5.
Flow cytometric analysis of intra-renal immune cell subpopulations at 48 h following Sham or CLP procedures with saline, single-dose hUC-MSC and double-dose hUC-MSC: Total cell numbers of intra-renal a lymphoid and b myeloid cell subpopulations quantified by multi-colour flow cytometry of CD45-enriched cell suspensions from collagenase/DNase-digested kidneys prepared at 48 h post-procedure from four groups of mice: SHAM+Saline+Saline (n = 9), CLP + Saline+Saline (n = 8), CLP + UC-MSC + Saline (n = 6) and CLP + UC-MSC + UC-MSC (n = 10). Statistical analysis: Non-Gaussian distribution: Kruskal-Wallis test with Dunn’s multiple comparison test, p < 0.05. Gaussian distribution: One-way ANOVA with Bonferroni multiple comparison post-test and with 95% confidence interval. *Significantly different from SHAM group (*p < 0.05, **p < 0.01, ***p < 0.001). Abbreviations: MP = mononuclear phagocytes

