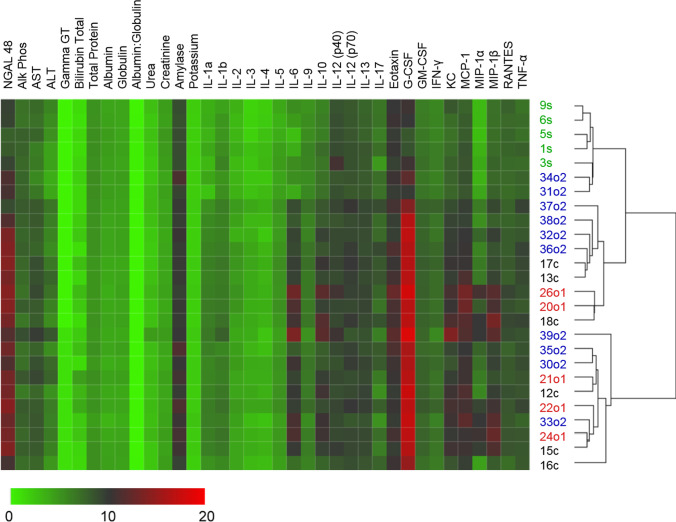
Fig. 6.
Unsupervised hierarchical clustering of response patterns of control and hUC-MSC-treated animals: Average linkage Euclidean distance clustering of data from Sham (green, s, n = 5), CLP (black, c, n = 6) and UC-MSC-treated animals with single (red, o1, n = 5) or double dose (blue, o2, n = 10) of 1 × 10⁶ UC-MSC. The lowest level is represented by green, while highest level is represented by red. All data except NGAL and Albumin:Globulin subjected to Log2 transformation prior to clustering

