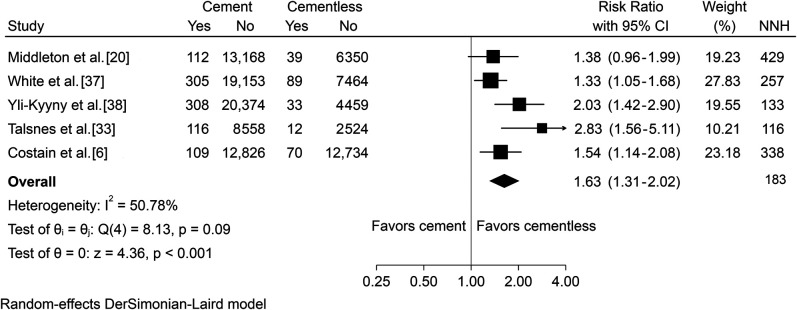
Fig. 3.
The forest plot shows risk ratios for any mortality within 48 hours after surgery. Risk ratios less than 1.0 favor cemented implants, and those greater than 1.0 favor cementless installed prostheses. Horizontal lines give 95% confidence intervals; NNH = number needed to harm, that is, the number of patients operated on with cemented prostheses to experience one death attributed to cemented treatment in each study and the pooled data; I2 = I-squared statistics (heterogeneity); Q = Cochran Q heterogeneity statistic (with degrees of freedom (df) and p value).

