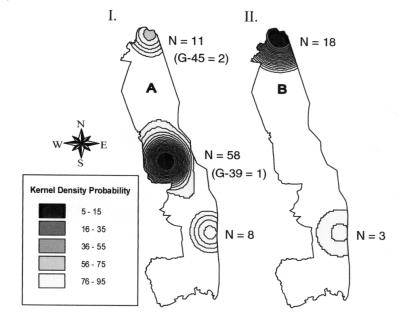
FIG. 4.
Kernel density probability of Kruger isolates. (I) This map shows the kernel density probabilities estimated for the Kruger A strains included in this study. Representation of minor strain subtypes (genotypes [G] 39 and 45) is indicated. (II) This map shows the kernel density probabilities for the Kruger B strains. The actual number of samples for each area (N) is also shown for both maps.

