
FIG. 5.
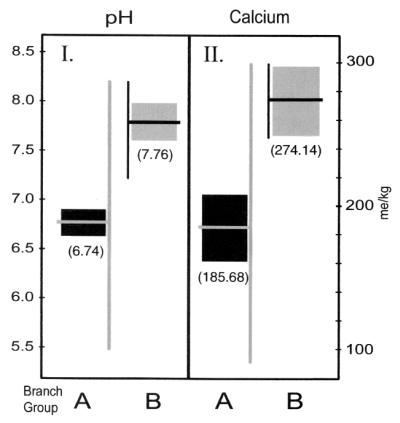
Genotype relationships with soil pH and calcium values. (I) Mean soil pH in parentheses (95% confidence interval and range of values for Kruger A and B genotype groups at the field isolate sites). (II) Mean soil calcium content (95% confidence interval and range of values for Kruger A and B genotype groups). In a nonparametric analysis of variance, the two strain type groups were statistically significantly different with respect to both soil pH (Z = 4.870 and P < 0.0001) and soil calcium (Z = 3.999 and P < 0.0001).