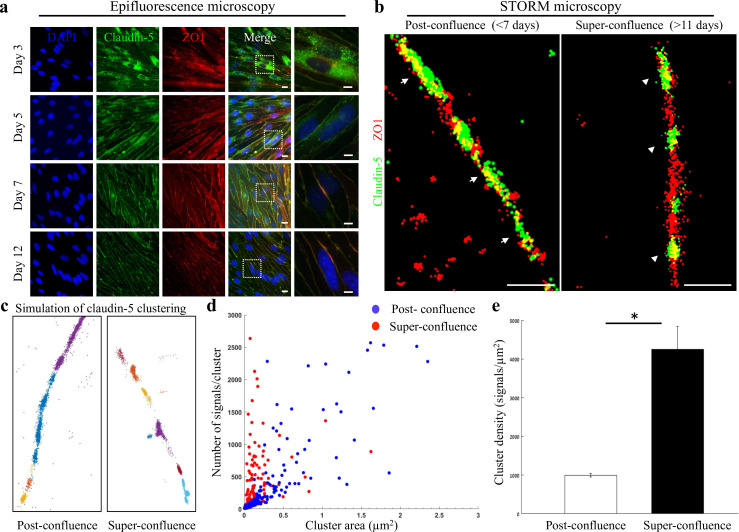
Figure 1. Super-resolution microscopy of endothelial tight junctions.
In vitro process of TJ maturation is accompanied by TJ architectural changes characterized by the formation of smaller, denser and more discrete clusters of TJ proteins. (a) Epi-fluorescent imaging of claudin-5 (green) and ZO1 (red) immunostaining of bEND.3 cells in indicated time points after the cultures reached confluence state. Note translocation of claudin-5 from cytoplasmic localizations into continuous lines around the boundaries of the cells (known as ‘strands’), along the in vitro maturation process. Scale bars, 10 µm and 5 µm in insets. (b) dSTORM imaging (Gaussian visualization) of claudin-5 (green) and ZO1 (red) immunostaining of bEND.3 cells confluent monolayers. TJ proteins form bead-like structures, especially in the super-confluence state. Claudin-5 signals are more concentrated in discrete and shorter foci (flanking ZO1 signals, arrowheads, right) than in the post-confluence state (arrows, left). During maturation TJ proteins translocate from different cellular locations (left) almost exclusively into the lateral cell membranes (right). Scale bar, 1 µm. (c) Examples of dSTORM imaging simulation of claudin-5 in bEND.3 cells used for quantifications of clustering properties (produced by a custom clustering Matlab code, see Materials and methods for details). Signals were defined to be clustered if their 2D location was smaller than 70 nm threshold distance. Cluster pattern visualization showing all points that belong to the same cluster with the same identifying color. (d) Quantifications of claudin-5 clustering properties showed a shift towards smaller clusters with more claudin-5 signals per cluster at the super-confluence state. Clusters with higher numbers of signals were more abundant at this late state, especially in clusters with area smaller than 0.3 μm2. (e) Average claudin-5 cluster density was ~4 fold higher at the super-confluence state than in the post-confluence state (n = 183 clusters (post-confluence) and 281 clusters (super-confluence) in five independent experiments). Data are mean ± s.e.m. *p < 0.05 (Two tailed Mann–Whitney U-test).


