
Figure 1. DNA repair proteins that affect genome editing outcomes.
(a) Schematic representation of the screen. Human embryonic kidney (HEK293T) cell line contains a reporter cassette expressing a selection marker, guide (sgGFP) and a mutant GFP-BFP protein. The line is transfected with a GFP repair oligo and an arrayed plasmid library containing ~450 DNA repair proteins that are fused to the C-terminus of Cas9WT. The homology-directed repair (HDR) editing efficiency for each fusion is defined by the percentage of cells with restored GFP function in each transfected well (measured by FACS). (b) Normalized GFP recovery values from two independent screens. Both experiments n = 3, each data point represents an average of value of all six replicas (n = 2 × 3), where each replicate was normalized either to the experimental average (blue dots) or to the plate average (orange dots). p-Values were calculated by one-way ANOVA test, where the mean of each triplicate is compared to the combined mean of all other triplicates from the screen. (c) Experiment average-normalized GFP recovery values for 52 fusions, chosen based on their performance in panel (b). In HEK293T n = 4, one independent biological experiment, in retinal pigment epithelium (RPE-1), n = 2, two independent biological experiments. Statistical significance is calculated as in (b). (d) Normalized GFP recovery values for 10 best-performing and five worst-performing Cas9 fusions from panel (c). Protein fragments are denoted based on the position in canonical transcript (i.e. SPIDR AA400-916 corresponds to a fragment of SPIDR protein which starts at amino acid 400 and ends at amino acid 916). (e) Schematic representation of the experiment shown in f. (f) Experiment average-normalized HDR editing for 31 fusions in four endogenous loci (ELANE, RNF2, Enh 4–1, and CTCF1) in HEK293T cells, quantified by droplet digital PCR. Polymerase fusions are marked with red pointers. n = 3, one independent biological experiment for each locus. Statistical significance is calculated as in (b). The raw data points are visible in Figure 1—figure supplements 3–6 . (j) Replication fork schematics. For all experiments, Cas9 was delivered as plasmid, the repair template as single-stranded oligonucleotide, and the guide was expressed from the genome.

Figure 1—figure supplement 1. Plasmid sizes and molar quantities of plasmids used in the high-throughput screens.
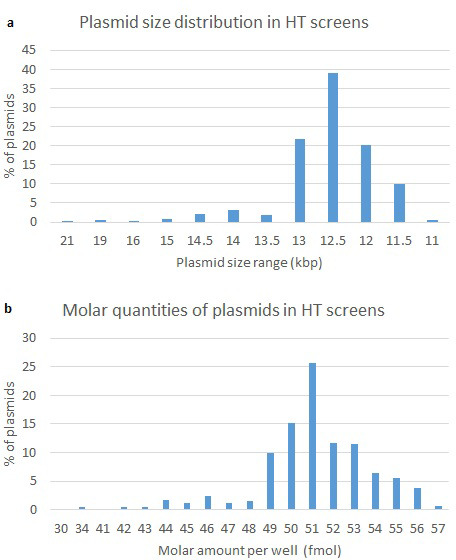
Figure 1—figure supplement 2. Homology-directed repair (HDR) efficiency of the best-performing fusions.

Figure 1—figure supplement 3. HDR efficiency of the best-performing fusions: % of HDR, % HDR of total editing and % of NHEJ in HEK293T cells that stably express the guide targeting CTCF1 endogenous locus.

Figure 1—figure supplement 4. HDR efficiency of the best-performing fusions: % of HDR, % HDR of total editing and % of NHEJ in HEK293T cells that stably express the guide targeting ELANE endogenous locus.

Figure 1—figure supplement 5. HDR efficiency of the best-performing fusions: % of HDR, % HDR of total editing and % of NHEJ in HEK293T cells that stably express the guide targeting Enh 4-1 endogenous locus.

Figure 1—figure supplement 6. HDR efficiency of the best-performing fusions: % of HDR, % HDR of total editing and % of NHEJ in HEK293T cells that stably express the guide targeting RNF2 endogenous locus.
