. 2021 Dec 13;10:e75415. doi: 10.7554/eLife.75415

Figure 2. Performance of the fusions in BJ-5ta cell line.

(a) Schematic representation of the experiment shown in b. (b) Normalized homology-directed repair (HDR) efficiency of the seven best-performing fusions in five endogenous loci in hTERT immortalized fibroblasts (BJ-5ta), quantified by droplet digital PCR (ddPCR). Heat maps represent values normalized to Cas9WT for each gene locus. The sets have an upper limit threshold and values above it are color-coded as a scale maximum (bright-red). One independent experiment for each gene locus, n = 4 for FANCF, Enh 4–1, RNF2, ELANE gene loci; n = 3 for STAT3 gene. The raw data points are visible in Figure 2—figure supplement 1a-j. For all experiments, Cas9 was delivered as mRNA, the repair template as single-stranded oligonucleotide, and the guide was expressed from the genome.

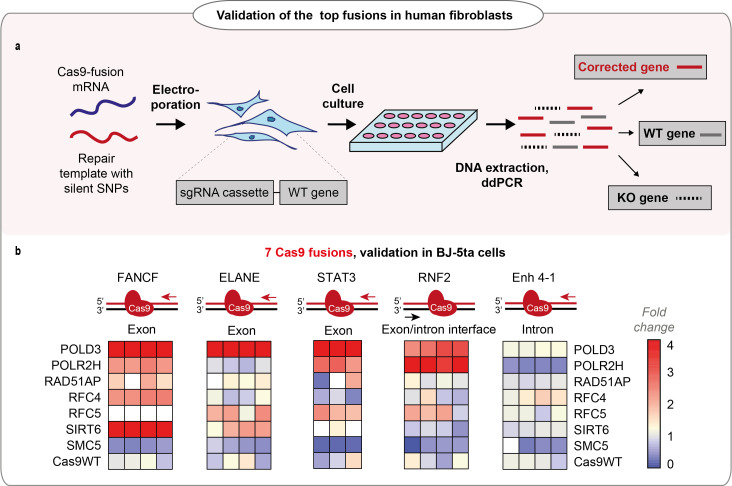
Figure 2.

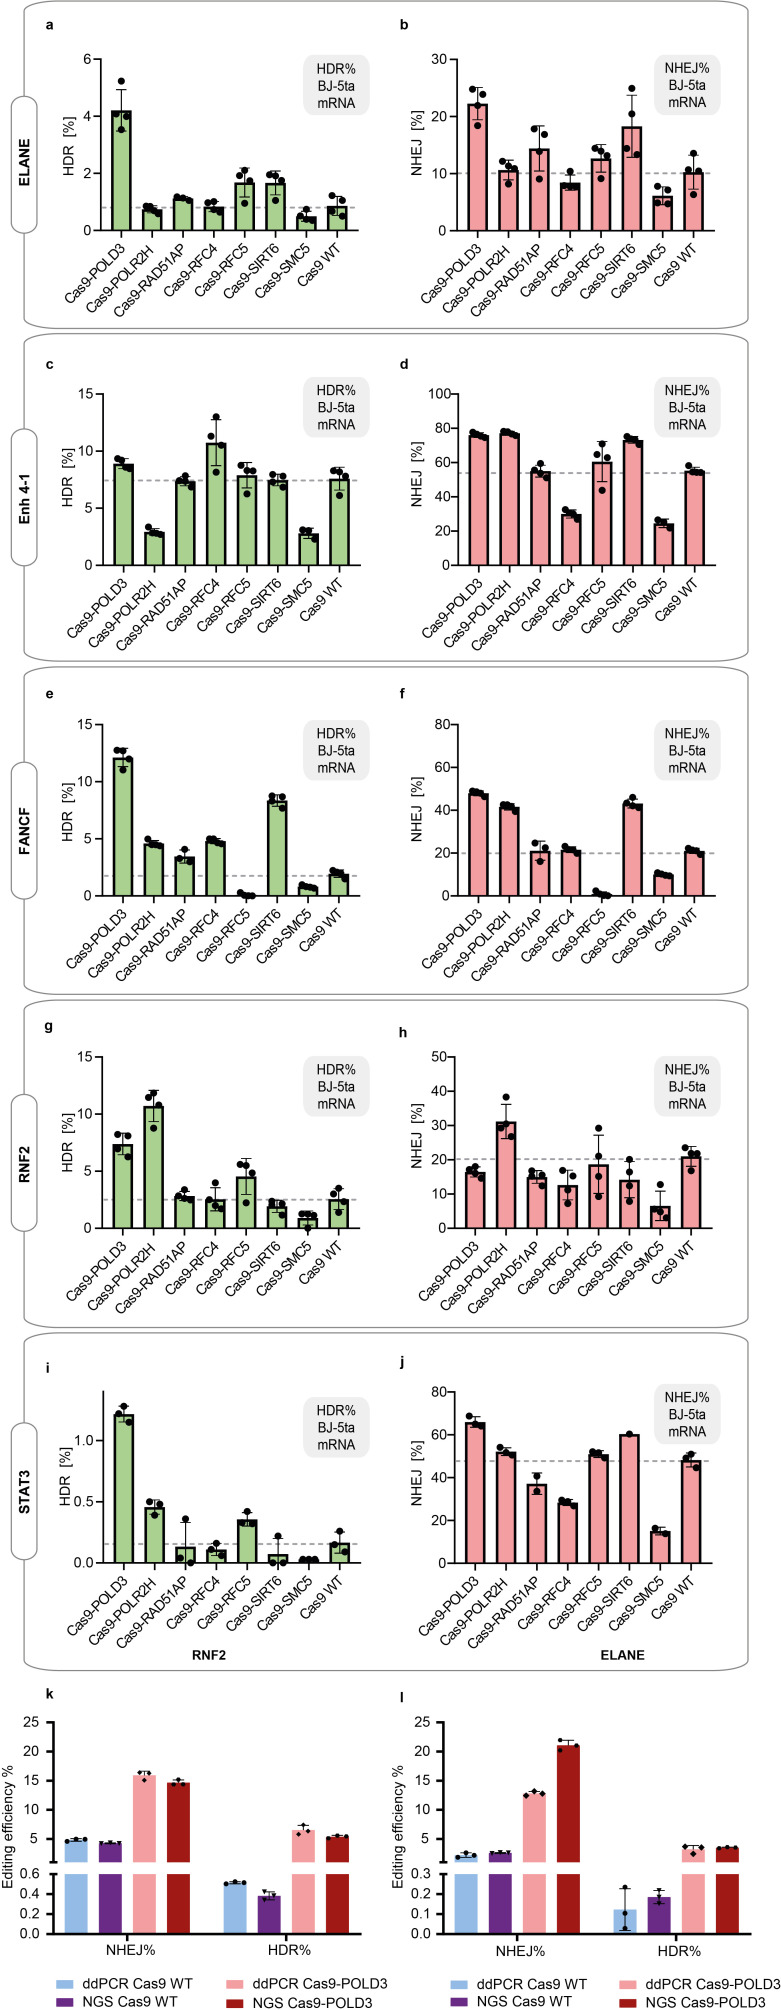
Figure 2—figure supplement 1. Cas9 fusion editing efficiency in immortalized fibroblasts (BJ-5ta) that stably express sgRNA targeting the indicated loci.

Figure 2—figure supplement 1.

(a–j) The cells were electroporated with Cas9 mRNA and repair DNA. Homology-directed repair (HDR) and non-homologous end-joining (NHEJ) editing were measured with droplet digital PCR (ddPCR). n = 3, one independent experiment, bar denotes mean value, error bars represent ± SD. The dataset is also presented in Figure 2b. (k–l) Comparison between the ddPCR and NGS-based editing detection, for RNF2 site (k) and ELANE site (l). n = 3, one independent experiment, bar denotes mean value, error bars represent ± SD.
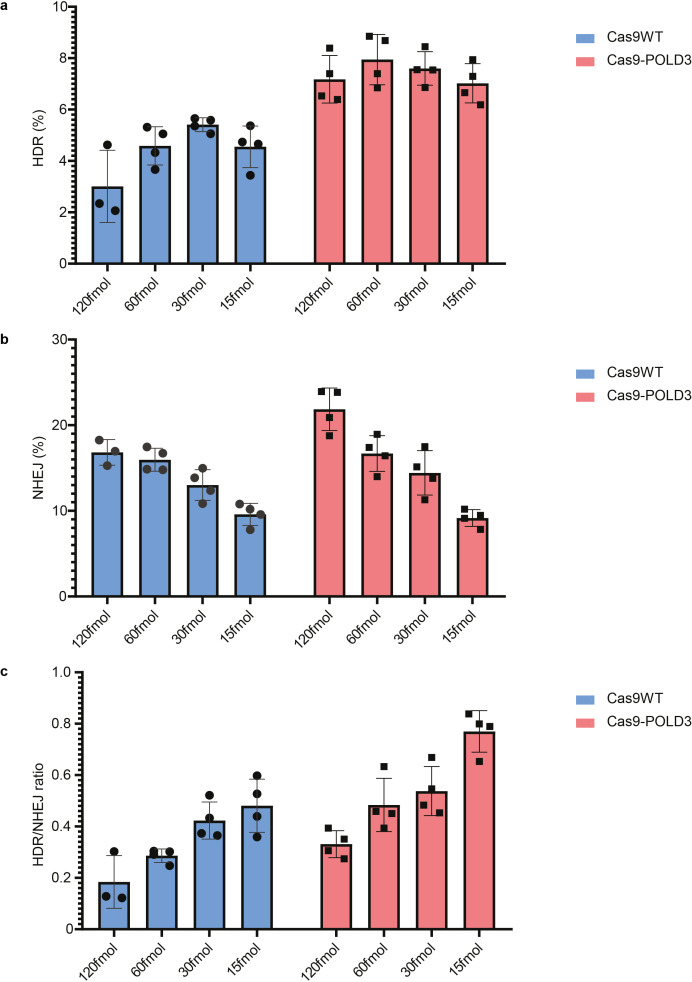
Figure 2—figure supplement 2. Cas9 fusion to DNA polymerase delta subunit 3 (Cas9-POLD3) editing in decreased concentrations.

Figure 2—figure supplement 2.

(a-c) % of homology-directed repair (HDR), % non-homologous end-joining (NHEJ), and HDR/NHEJ evaluated by droplet digital PCR (ddPCR) represent fusion protein performance across different plasmid concentrations in reporter RPE-1 cells, GFP locus. n = 4, representative of two independent experiments, bar denotes mean value, error bars represent ± SD.