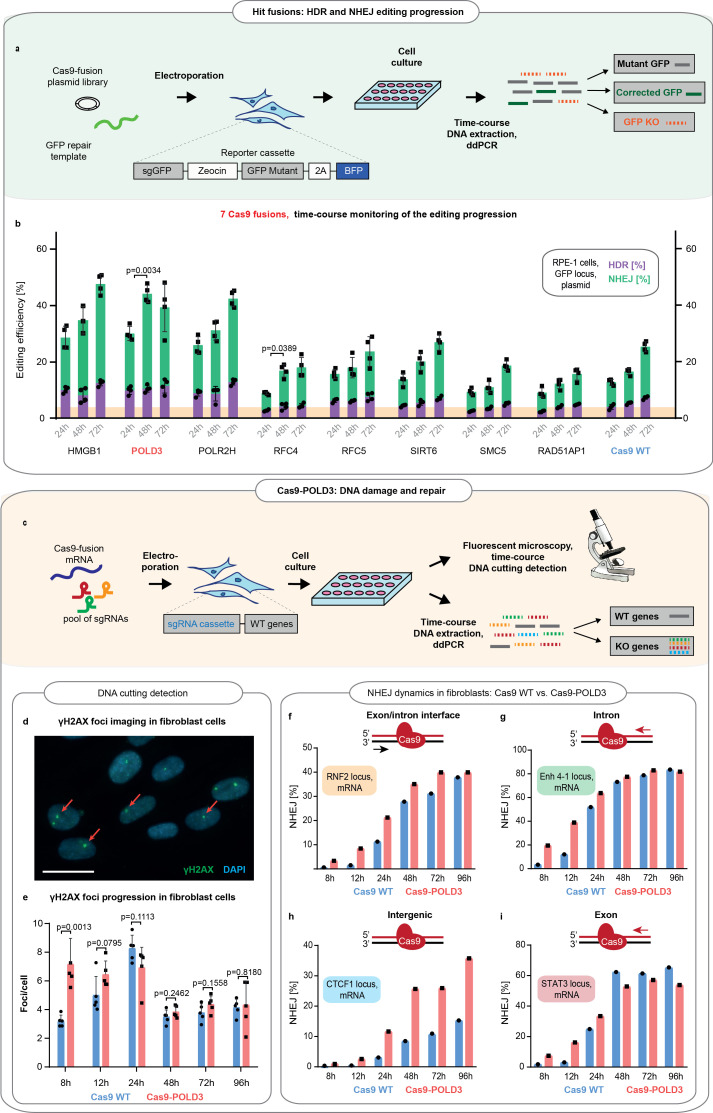
Figure 3. Comparison of the DNA repair dynamics between Cas9 fusions.
(a) Schematic representation of experiment shown in b. (b) The DNA repair progression in the retinal pigment epithelium (RPE-1) reporter locus for eight of the better-performing fusions (selected from screens on Figure 1c-f). Droplet digital PCR (ddPCR) quantification, n = 3, single independent experiment, bar denotes mean value, error bars represent ± SD. Orange highlighting indicates the Cas9WT homology-directed repair (HDR) editing level at 24 hr post-electroporation. p-Values denote significance of the total editing (HDR+ non-homologous end-joining [NHEJ]) increment between the Cas9WT and other fusions (for 24–48 hr period). Statistical values derived using one-way ANOVA test. Cas9 was delivered as plasmid, the repair template as single-stranded oligonucleotide, and the guide was expressed from the genome. (c) Schematic representation of experiment shown in d–i. (d) Representative immunofluorescence image used for DNA breakpoint quantification. Cell nuclei are depicted in blue, γH2AX foci in green, and red arrows indicate individual foci. Scale bar 50 µm. (e) Time course for γH2AX foci emergence in human immortalized fibroblasts (BJ-5ta). The cells were electroporated with Cas9WT or Cas9 fusion to DNA polymerase delta subunit 3 (Cas9-POLD3) mRNA and a pool of three guides targeting RNF2, Enh 4–1, and STAT3 loci. The CTCF1 gRNA is constitutively expressed. Five confocal images were taken for each condition, n = 5, single independent experiment, bar denotes mean value, error bars represent ± SD. Statistical significance of the difference between Cas9WT and Cas9-POLD3 is calculated using ANOVA test for the equality of the means at a particular time point. (f–i) ddPCR quantification of the NHEJ repair dynamics across time for the experiment described in (e). The red arrow shows the direction of the approaching polymerase. The DNA strand which the CRISPR-Cas9 binds to is colored in red. n = 1, single independent experiment, bar denotes mean value, error bars represent ± SD. Cas9 was delivered as mRNA, the repair template as single-stranded oligonucleotide, one guide was expressed from the genome and three guides transfected as synthesized oligonucleotides.

