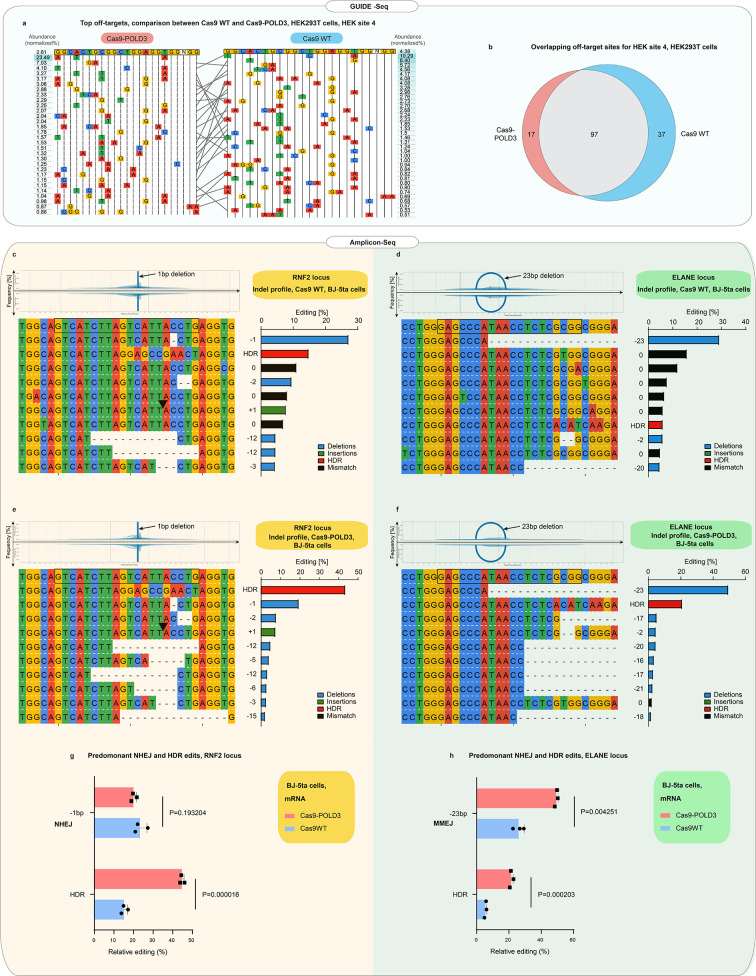
Figure 5. Off-target and indel profiles of wild-type (WT) and Cas9 fusion to DNA polymerase delta subunit 3 (Cas9-POLD3) nucleases.
(a) Mismatch plot of the GUIDE-Seq (Tsai et al., 2015) results for Cas9WT and Cas9-POLD3, using a published guide (Tsai et al., 2015) against the endogenous human embryonic kidney (HEK) site 4. Cas9 and the guide were co-transfected as plasmids. The on-target sequence is depicted at the first line of the table. The most abundant off-targets are listed underneath the intended edit and sorted by frequency, which is determined by dividing the number of reads that contain the off-target edit with the total read count. Gray lines connect the shared off-target sites. (b) Venn diagram of the common and unique off-target sites between Cas9WT and Cas9-POLD3. (c–f) Mismatch plots of the indel profiles of Cas9WT and Cas9-POLD3 in BJ-5ta fibroblasts, obtained by deep amplicon sequencing. Cas9 was delivered as mRNA, the repair template as single-stranded oligonucleotide, and the guide was expressed from the genome. The on-target gRNA-binding site is on the top row, highlighted with a black box. The most frequent indels are below, sorted according to their frequency. The indel frequency is calculated by dividing the indel read count by the sum of the top 10 indel read counts. The edits matching the homology-directed repair (HDR) template are marked in red in the summary plots. Plots depict: (c) On-target editing signature of Cas9WT, RNF2 locus. (d) On-target editing signature of Cas9WT, ELANE locus. (e) On-target editing signature of Cas9-POLD3, RNF2 locus. (f) On-target editing signature of Cas9-POLD3, ELANE locus. (g–h) The most common non-homologous end-joining (NHEJ) and HDR editing outcomes depicted in bar graphs. n = 3, bar denotes mean value, error bars represent ± SD. Statistical significance is calculated with unpaired, two-sided Student’s t-test.


