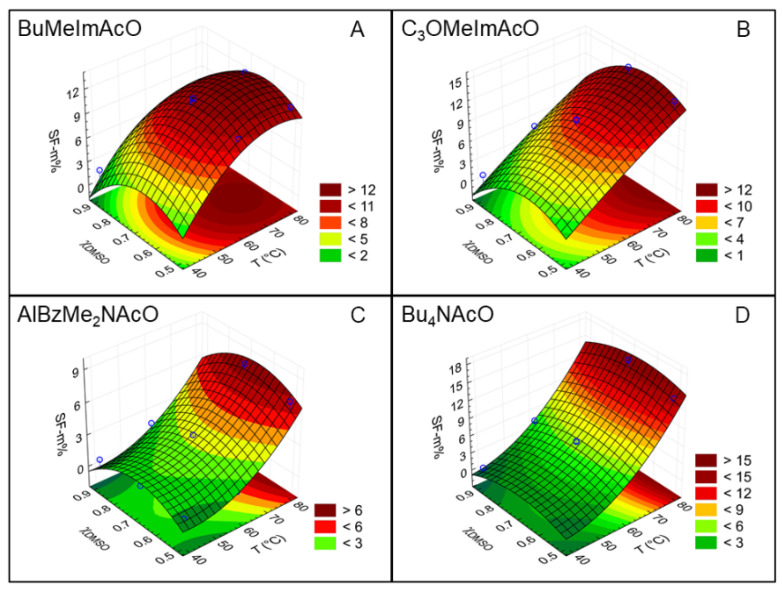
Figure 6.
Response-surface plots for the dependence of silk fibroin dissolution on the temperature T, and mole fraction of DMSO, χDMSO for the four IL-DMSO mixtures employed. We generated these plots from the data of Table S2, using second-order polynomials. Parts (A–D) refer to the ionic liquids studied.

