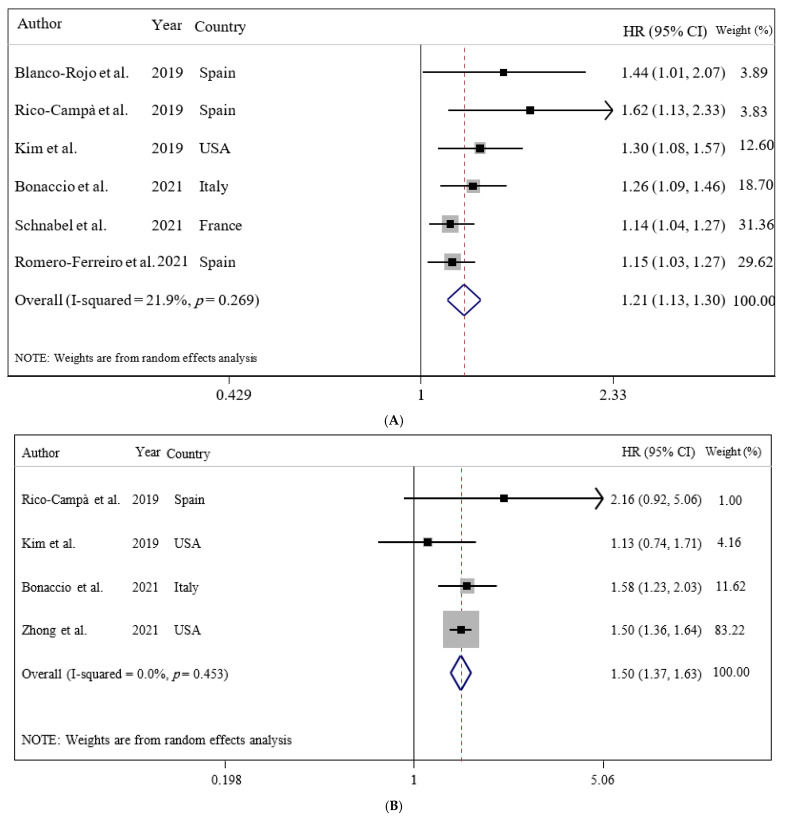
Figure 2.
Forest plots demonstrating OR and 95% CI of pooled results from the random effects models to evaluate the relationship between ultra-processed food consumption and risk of mortality: (A) all-cause, (B) CVD-cause, (C) heart-cause, and (D) cancer-cause. The study-specific HR and 95 % CI are represented by black squares and horizontal lines, respectively; the area of the grey square is proportional to the specific-study weight to the overall meta-analysis. The center of the open diamond and the vertical dashed line represent the pooled HR, and its width represents the pooled 95 % CI.


