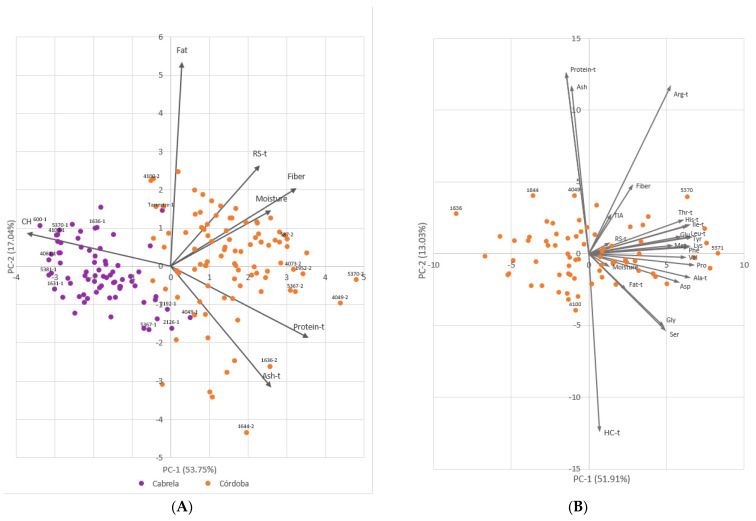
Figure 2.
Principal component analysis based on BLUEs of nutritional composition and protein quality-related traits measured in a collection of 106 Portuguese common bean accessions. (A) Biplot representing accessions grown in Cabrela (purple) and accessions grown in Córdoba (orange). Trait loading vectors of the seven nutritional composition-related traits are represented by arrows. Relevant accessions are identified by their accession numbers followed by 1 or 2 according to the corresponding environment: 1-Cabrela; 2-Córdoba. (B) Biplot representing accessions grown in Córdoba (orange). Trait loading vectors of the 24 nutritional composition and protein quality-related traits are represented by arrows. CH-carbohydrates; RS-resistant starch; Ala-alanine; Arg-arginine; Asp-aspartic acid; Glu-glutamic acid; Gly-glycine; His-histidine; Ile-isoleucine; Leu-leucine; Lys-lysine; Met-methionine; Phe-phenylalanine; Pro-proline; Ser-serine; Thr-threonine; Tyr-tyrosine; Val-valine; TIA-trypsin inhibitor activity. The “-t” after the trait’s name indicates that data was transformed following a Box-Cox transformation.

