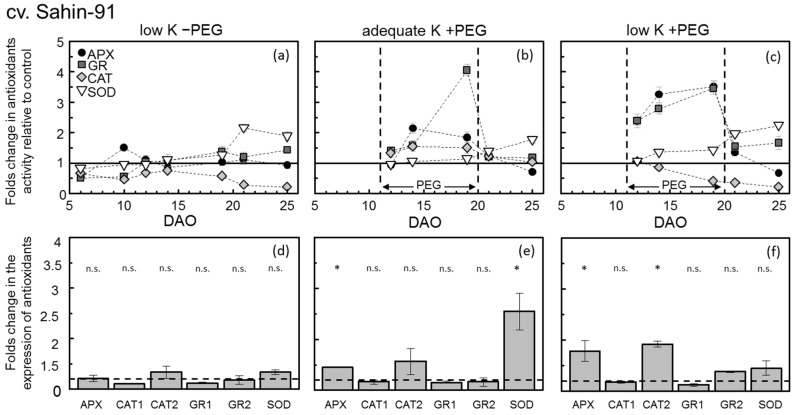
Figure 4.
Temporal course of antioxidant (APX, GR, CAT, SOD) activities in fully expanded young leaves (above) 5–25 days after the onset of K treatments (DAO) and the relative gene expression at 14 DAO (below) of barley (cv. Sahin-91) grown in a nutrient solution under two levels of K supply (adequate K: 0.8 mM K+; low K 0.04 mM K+) without and with a PEG-induced water deficit (−PEG; +PEG). On each sampling day, values of the treatments “low K −PEG”, “adequate K +PEG” and “low K +PEG” are expressed as fold changes in comparison to control (“adequate K −PEG” = 100%, represented by the solid horizontal line in each plot). Symbols represent means ± SE (n = 6). In the gene expression plots, the dashed horizontal lines similarly represent the control treatment (“adequate K −PEG” = 1), and the bars reflect the fold changes of the selected genes in comparison to control. GR1 and GR2 represent chloroplastic and cytosolic glutathione reductase, respectively. SOD; chloroplastic superoxide dismutase, CAT1 and CAT2; two catalase gene copies and APX; peroxisome type ascorbate peroxidase. Each single combination of K-level × PEG-level × barley-variety for antioxidant activity is shown by the letters (a–c) and the exact same combination for gene expression is represented by letters (d–f). The significant expressions are shown with * (p < 0.05). All samples were taken at 13:00 h.

