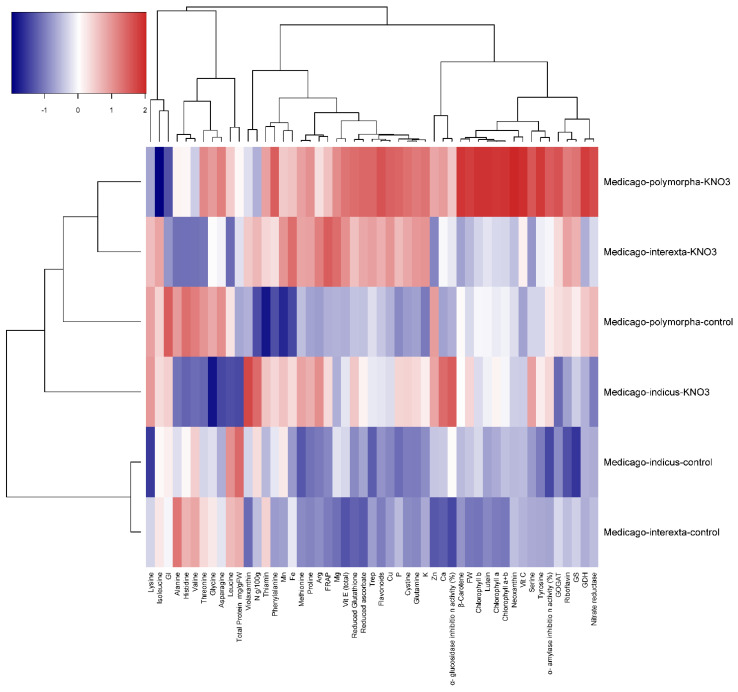
Figure 5.
The cluster heatmap of primary and secondary metabolites of three Medicago species KNO3 priming treatment. The graph’s horizontal axis shows different treatments for each species, and the vertical axis shows different phytocompounds, amino acids, and nitrogen content. Color gradients represent the different values of contents under KNO3 priming compared with that of control.

