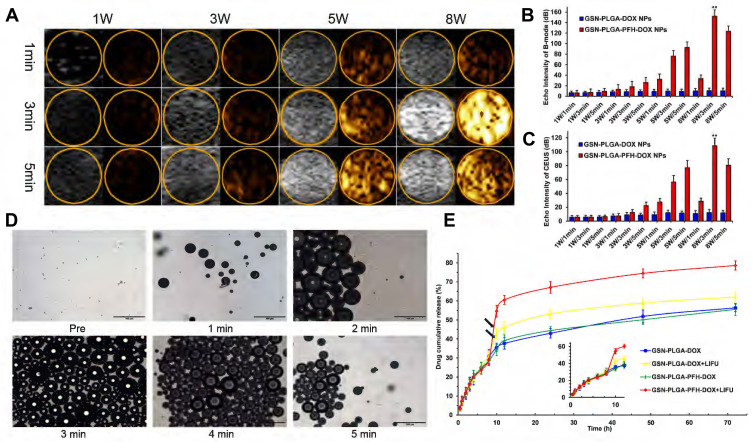
Figure 4.
(A) Corresponding B-mode and CEUS images of the phase transition process of the GSN-PLGA-PFH-DOX NPs under LIFU irritation with different powers and times, as observed in vitro. Quantitative echo intensity of GSN-PLGA-PFH-DOX NPs and GSN-PLGA-DOX NPs in B-mode (B) and CEUS imaging (C) at different time points and powers under LIFU irradiation (**P<0.001 vs the other groups). (D) OM images of the LIFU-responsive phase transition process with a power of 8 W/5 min at different time points. (E) Drug-release profiles triggered by LIFU irritation (black arrow: ultrasound administration).

