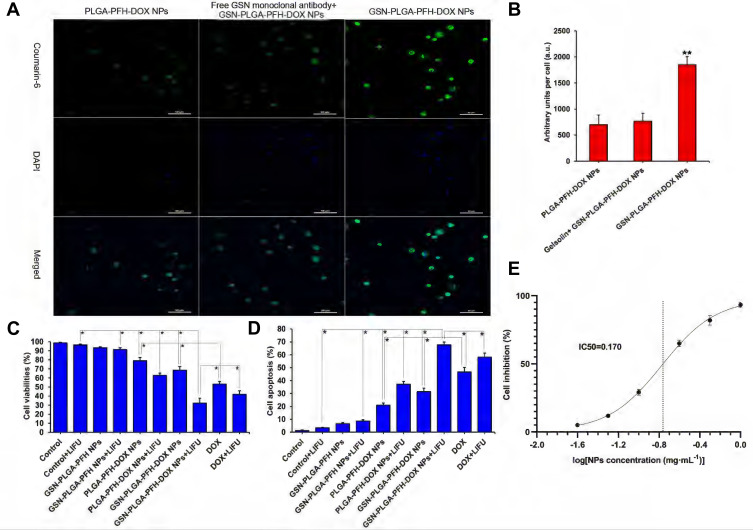
Figure 5.
(A) Cell uptake observed by LSCM (Coumarin-6: green, DAPI: blue) (Scale bar=50 μm). (B) Histogram of the quantitative study of the cellular uptake efficiencies of different groups (**P<0.001 vs the other two groups). (C) Cell viability rates of various therapeutic agents, *P<0.05. (D) Cell apoptosis rate of various therapeutic agents, *P<0.05. (E) Fitting curve of half inhibition concentration of NPs.

