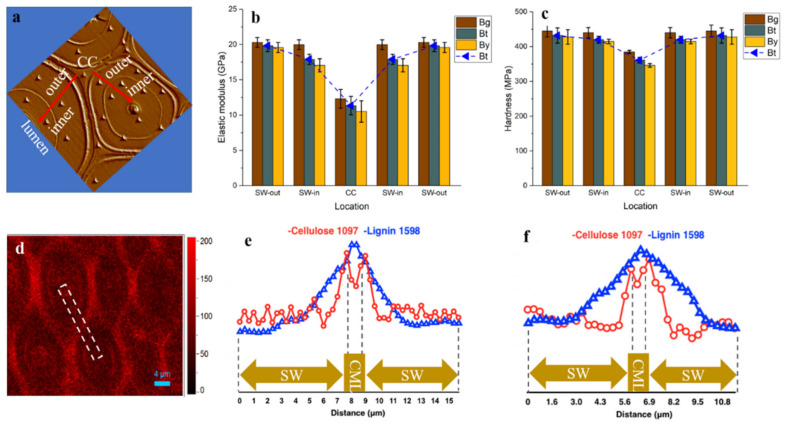
Figure 6.
(a) The image obtained after indenting shows the actual position of indents; (b,c) The elastic modulus and hardness of bamboo fiber at different locations; (d) Raman image showing the cellulose microfibrils orientation distribution by integrating over 1097 cm−1; (e,f) the Raman line scan of Bg (e) and Bt (f) fiber wall. The white dotted line indicates the typical region of the Raman spectra collected. SW-out: outer layer of fiber secondary wall; SW-in: inner layer of fiber secondary wall.

