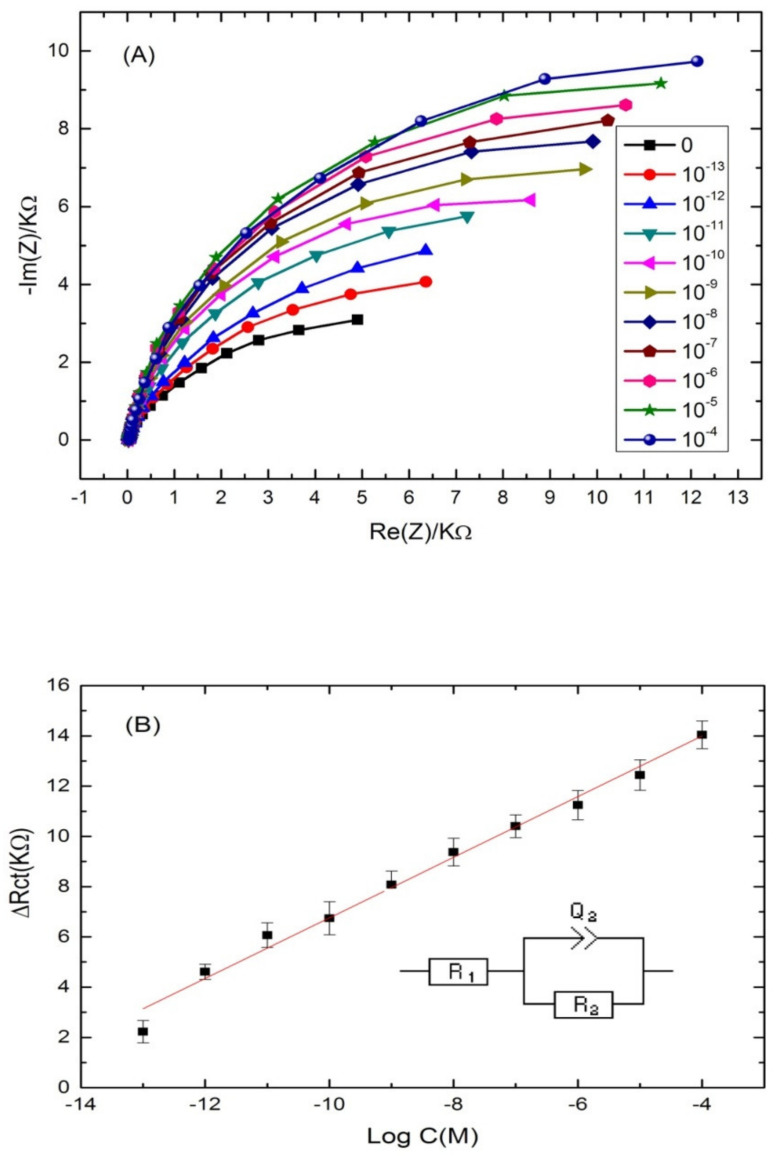
Figure 4.
(A) Nyquist plots of Cd-aptamer-modified surface incubated with increasing concentrations of cadmium ranging from 10−4 to 10−13 M. Measurements were performed in buffer (pH 4.5) at a potential of −0.5 V and a frequency range from 10 kHz to 100 mHz. (B) Calibration plots of the increase of the charge transfer resistance with cadmium concentration for the label free aptasensor. Inset: equivalent circuit used for the EIS equivalent circuit fitting.

